Fig. 14
Download original image
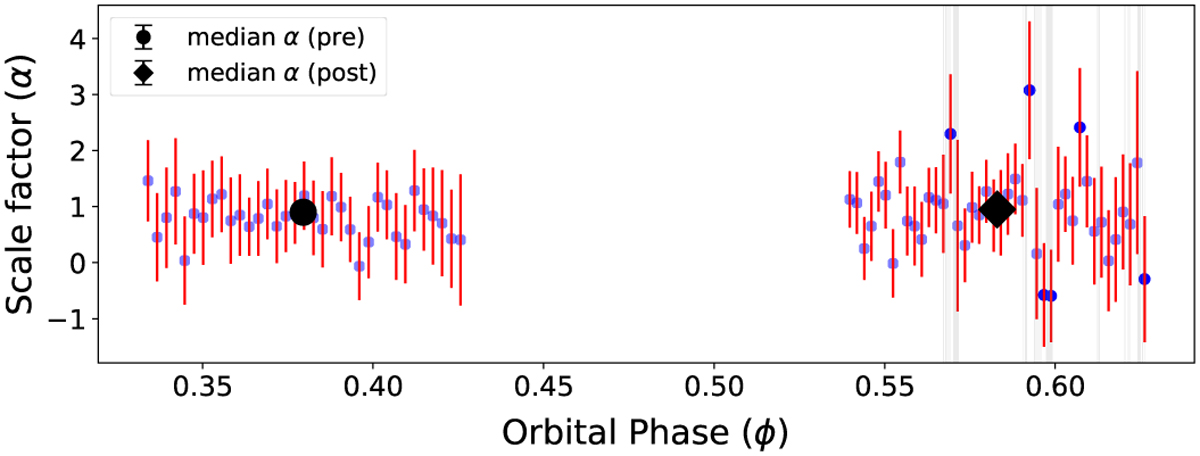
Model scaling factor (α) versus the orbital phase for MASCARA-1b. For visualisation purposes, frames from the individual dataset have been binned together. The α values (blue dots) and their uncertainties for each frame are derived from the conditional likelihood distribution (see text). The black markers show the retrieved median α for the individual datasets. The dark blue points denote outliers corresponding to cloud-affected frames, located within the regions marked by vertical grey bands.
Current usage metrics show cumulative count of Article Views (full-text article views including HTML views, PDF and ePub downloads, according to the available data) and Abstracts Views on Vision4Press platform.
Data correspond to usage on the plateform after 2015. The current usage metrics is available 48-96 hours after online publication and is updated daily on week days.
Initial download of the metrics may take a while.