Fig. 10
Download original image
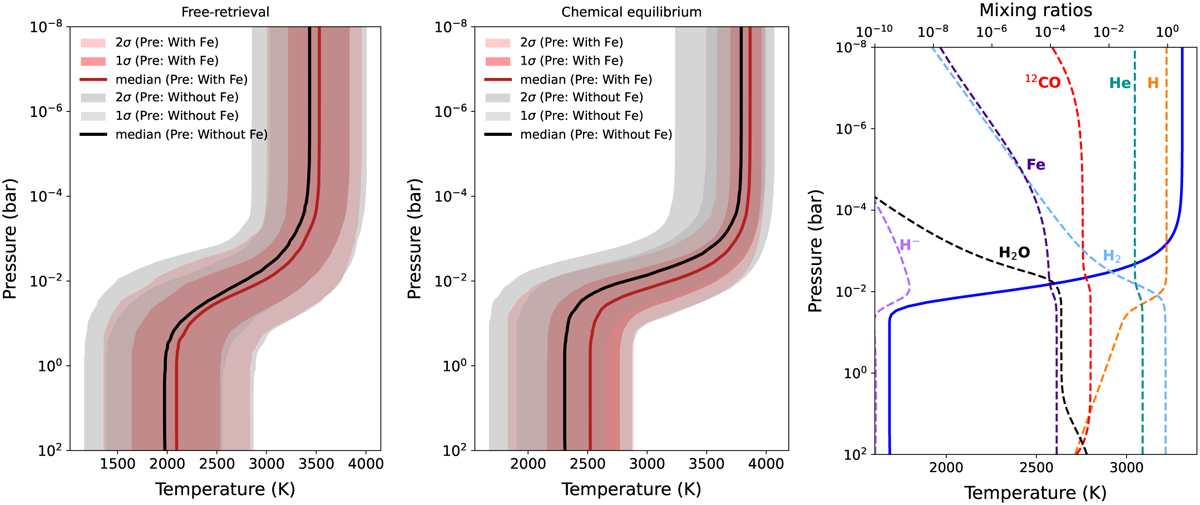
Left and middle panel: retrieved T–P profiles (Guillot 2010) for the pre-eclipse data with the inclusion of iron (i.e. CO+H2O+Fe; red) and without iron (i.e. CO+H2O; black) under the two retrieval setups outlined in Sect. 4.1. The red and grey shading marks the 1σ and 2σ recovered distribution computed from 10 000 samples from the MCMC. Right panel: the atmospheric structure for the pre-eclipse dataset from the best-fitting CO+H2O only model. The volume mixing ratio profiles for the continuum and detected species are shown as dashed lines (calculated using FASTCHEM), with the parametric T–P profile shown as a solid blue line.
Current usage metrics show cumulative count of Article Views (full-text article views including HTML views, PDF and ePub downloads, according to the available data) and Abstracts Views on Vision4Press platform.
Data correspond to usage on the plateform after 2015. The current usage metrics is available 48-96 hours after online publication and is updated daily on week days.
Initial download of the metrics may take a while.