Open Access
Fig. 1
Download original image
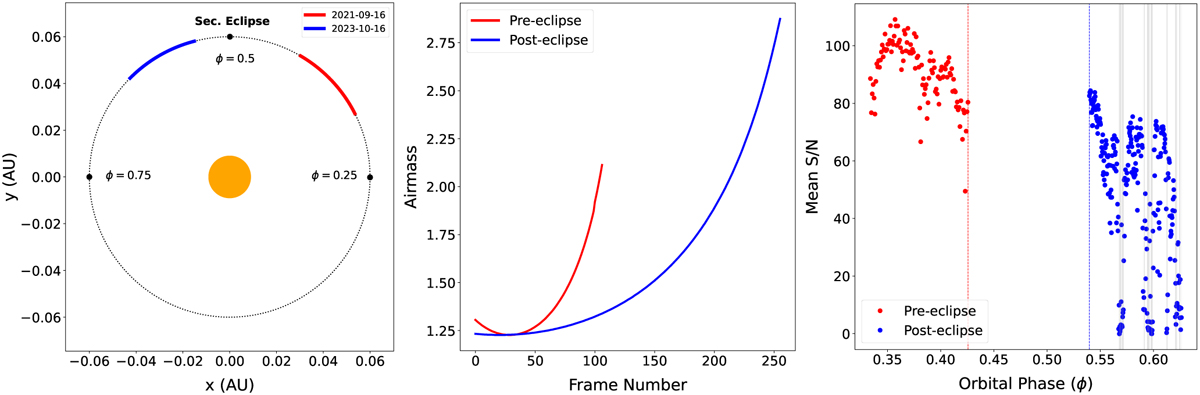
Left: phase coverage of our CRIRES+ pre- and post-eclipse observations. Middle and right: observing conditions showing the variation of airmass and mean signal-to-noise ratio (S/N) with orbital phase. Vertical grey bands denote cloud-affected regions.
Current usage metrics show cumulative count of Article Views (full-text article views including HTML views, PDF and ePub downloads, according to the available data) and Abstracts Views on Vision4Press platform.
Data correspond to usage on the plateform after 2015. The current usage metrics is available 48-96 hours after online publication and is updated daily on week days.
Initial download of the metrics may take a while.