Fig. 14
Download original image
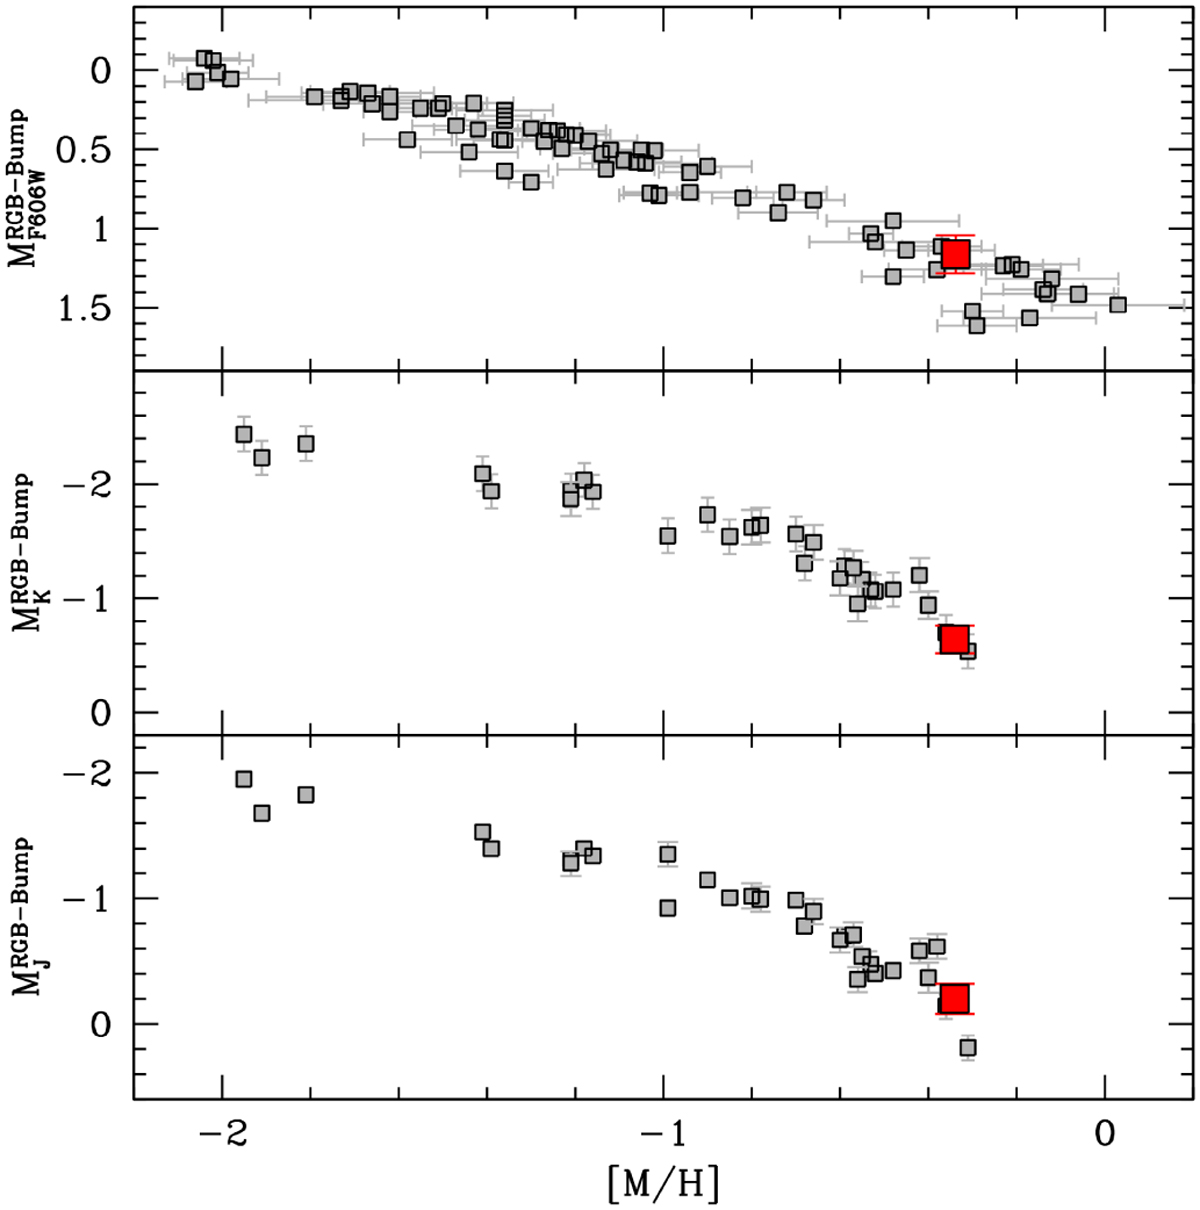
Absolute magnitude of the RGB bump in the mF606W, K, and J bands (from top to bottom) as a function of the cluster global metal- licity [M/H]. The small gray squares are data from the literature: in the upper panel from Nataf et al. (2013a); Pallanca et al. (2021); Deras et al. (2024), in the central and bottom panels from Valenti et al. (2004, 2007); Pallanca et al. (2021). In all the panels the large red squares mark the location of the RGB bump estimated here for Terzan 6.
Current usage metrics show cumulative count of Article Views (full-text article views including HTML views, PDF and ePub downloads, according to the available data) and Abstracts Views on Vision4Press platform.
Data correspond to usage on the plateform after 2015. The current usage metrics is available 48-96 hours after online publication and is updated daily on week days.
Initial download of the metrics may take a while.