| Issue |
A&A
Volume 695, March 2025
|
|
|---|---|---|
| Article Number | A10 | |
| Number of page(s) | 6 | |
| Section | Extragalactic astronomy | |
| DOI | https://doi.org/10.1051/0004-6361/202453457 | |
| Published online | 26 February 2025 | |
Evidence of a diffuse, extended continuum source in quasars from the relative sizes of the broad line region and the UV-optical continuum source measured with microlensing
Institut d’Astrophysique et de Géophysique, Université de Liège, Allée du 6 Août 19c, B5c, 4000 Liège, Belgium
⋆ Corresponding author; This email address is being protected from spambots. You need JavaScript enabled to view it.
Received:
16
December
2024
Accepted:
5
February
2025
Abstract
Microlensing by stars in the lens galaxy of a gravitationally lensed quasar is a phenomenon that can selectively magnify quasar subregions, producing observable changes in the continuum brightness or distortions in the emission line profiles. Hence, microlensing allows us to probe the inner quasar regions. In this paper, we report measurements of the ratio of the broad emission line region (BLR) radius to the continuum source radius in eight lensed quasars, for the C IV, Mg II, and Hα emission lines and their respective underlying continua at λλ 1550 Å, 2800 Å, and 6563 Å. The microlensing-induced line profile distortions and continuum magnifications were observed in the same single-epoch datasets, and simultaneously compared with microlensing simulations. We found that, on average, the inner radius of the BLR starts at the end of the UV-optical continuum source, independently of the line ionization and the wavelength of the continuum. The half-light radius of the BLR is, on average, a factor of six larger than the half-light radius of the continuum source, independently of the quasar’s bolometric luminosity. We also found a correlation between the BLR radius and the continuum source radius, supporting the idea that the dominant contribution to the UV-optical continuum may come from the BLR itself. Our results independently confirm the results of reverberation mapping studies, and extend them to higher-redshift, higher-luminosity quasars.
Key words: gravitational lensing: micro / quasars: emission lines / quasars: general / quasars: supermassive black holes
Research Director F.R.S.-FNRS.
© The Authors 2025
 Open Access article, published by EDP Sciences, under the terms of the Creative Commons Attribution License (https://creativecommons.org/licenses/by/4.0), which permits unrestricted use, distribution, and reproduction in any medium, provided the original work is properly cited.
This article is published in open access under the Subscribe to Open model. This email address is being protected from spambots. You need JavaScript enabled to view it. to support open access publication.
1. Introduction
The rest-frame UV-optical spectrum of active galactic nuclei (AGNs) and their luminous counterparts, quasars1, is characterized by the presence of a strong, blue continuum, the so-called big blue bump, together with broad emission lines (BELs) of low and high ionization. While it is well established that the AGN phenomenon is powered by the accretion of matter onto a supermassive black hole, the origin of the UV-optical continuum and the properties of the broad emission line region (BLR) are still unclear. Early models assumed that the UV-optical continuum originates in a standard Shakura-Sunyaev thin accretion disk, at a typical distance of one light-day from the supermassive black hole, and that it irradiates a roughly spherically symmetric BLR, two to three orders of magnitude larger based on simple photoionization arguments (e.g., Urry & Padovani 1995; Peterson 1997; Netzer 2013).
By measuring the time delay between the brightness variations in the continuum source and the distant BLR, reverberation mapping (RM) has provided the first reliable estimates of the BLR radius. Based on a statistically significant sample of 19 AGNs, Wandel et al. (1999) reported BLR radii in the range of 1−100 light-days, which was significantly smaller than what was expected from early models. Since then, these results have been confirmed for hundreds of quasars (e.g., Cackett et al. 2021, for a review). On the other hand, using microlensing from stars in intervening galaxies as a gravitational telescope, the size of the UV-optical continuum source was found to be a factor of 3−4 larger than what was expected from the standard accretion disk model (Morgan et al. 2010; Blackburne et al. 2011). This discrepancy was confirmed by intensive wavelength-dependent RM studies of the continuum from the far-UV to the near-IR (e.g., Fausnaugh et al. 2016; Cackett et al. 2018, 2020), making the sizes of the BLR and the continuum source much less different than previously thought. In particular, some of the most comprehensive monitoring campaigns to date have shown that the optical (λ > 5000 Å, rest-frame) continuum source is comparable in size to the inner, highly ionized BLR (Fausnaugh et al. 2016; Kara et al. 2021). Although limited to a few local AGNs, these results have profound implications for the interplay between the accretion disk, the UV-optical continuum-emitting source, and the BLR, but they also complicate the interpretation of the RM time lags, since the continuum can no longer be considered as emitted by a point-like source (Pei et al. 2017).
Microlensing by stars in the lens galaxy of a gravitationally lensed quasar is a phenomenon that allows us to probe the properties of the inner regions of the quasar in a different way. Microlensing can selectively magnify quasar subregions, mostly depending on their size, producing changes in the continuum brightness or deformations of the emission line profiles in some images of the lensed quasar. By comparing microlensing-induced variations with simulations, the size of the continuum source and the BLR can be derived (e.g., Vernardos et al. 2024, for a recent review). Compared to RM, which requires intensive monitoring campaigns, microlensing has the advantage that single epoch spectra of the different images of a gravitationally lensed system may be sufficient to derive size estimates. On the other hand, only lensed quasars can be used and a clear microlensing effect must be observed in one of the images.
Recently, we used the microlensing-induced BEL profile distortions observed in single-epoch spectra of eight lensed quasars to constrain the geometry, kinematics, and size of the C IV, Mg II, or Hα BLRs (Hutsemékers et al. 2024a,b). The method not only compares the observed line profile distortions with simulations, but also includes the magnification of the underlying continuum measured on the same spectra, so that the relative sizes of the BLR and the continuum source can be estimated simultaneously. In this paper, we report the measurement of the ratio of the BLR radius to the continuum source radius, for the eight lensed quasars, noting that these quasars have higher redshifts and luminosities than the AGNs targeted by the intensive RM campaigns. In Sect. 2, we briefly summarize the method. The results are presented in Sect. 3, interpreted in Sect. 4, and summarized in the last section.
2. Microlensing analysis and simulations
The analysis of the observed microlensing signals and the comparison with simulations to derive the properties of the BLR are described in Hutsemékers et al. (2023, 2024a,b). The models of the BLR and the continuum source are detailed in Braibant et al. (2017). The probabilistic analysis is developed in Hutsemékers et al. (2019). Here, we briefly summarize the method.
We considered eight lensed quasars (Table 1) in which significant line profile deformations due to microlensing were observed in either the C IVλ1550, Mg IIλ2800, or Hα BEL. For each object and line, the distorted line profile observed in the microlensed image was compared to the line profile simultaneously observed in a non-microlensed image to extract, on a velocity scale, the microlensing magnification profile, μ(v), binned into 20 spectral elements. At the same time, we evaluated the magnification of the continuum underlying the emission line, μcont. This constitutes the set of 21 observables to be compared with the simulations.
Targets.
To simulate the effect of microlensing, we built a model that contains a continuum source and a BLR. The continuum source is modeled by a disk of constant surface brightness of radius rs. For the BLR models, we considered a rotating Keplerian disk, a biconical, radially accelerated polar wind, and a radially accelerated equatorial wind. We assumed that the emissivity can be expressed as ε = ε0 (rin/r)q, where rin is the inner radius of the BLR model and q = 3 or 1.5, so that it either decreases sharply with increasing radius, or does so more slowly (see Braibant et al. 2017, for details). Using a radiative transfer code, we generated 20 monochromatic (isovelocity) BLR images corresponding to 20 spectral bins in the line profile.
We then computed a magnification map specific to the microlensed image in each lensed system. Distorted line profiles were obtained by convolving, for a given value of rin, the magnification map with the monochromatic images of the BLR. The continuum emitting region was similarly convolved for a given value of rs. Simulated μ(v) and μcont were then obtained for each position of the model on the magnification maps. We emphasize that the simulated μ(v) and μcont were not computed independently; since the continuum source and the BLR were attached in the models, only μ(v) and μcont obtained from the same positions on the magnification maps were considered. This process was repeated for a series of values of the radii rin and rs (typically 15 values each2, approximately 225 combinations), four inclinations of the whole system with respect to the line of sight, two values of q, and seven orientations of the magnification map. Finally, the likelihood that the simulations reproduce the 21 observables was computed for each set of parameters.
3. Ratios of the BLR to continuum source radii
The relative probabilities of the different combinations of rin and rs (hereafter rin BLR and rs Cont) were obtained by marginalizing the likelihood over all other parameters. Figure 1 shows the posterior probability densities, uniformly resampled on a logarithmic scale, of the ratio rin BLR/rs Cont, for the different objects and lines. The BLR half-light radius, r1/2 BLR, which represents the effective size of the BLR probed by microlensing, was computed from rin BLR for the different BLR models, emissivities, and inclinations (see Hutsemékers & Sluse 2021), while the half-light radius of the continuum source is simply given by r1/2 Cont = rs Cont/ for a uniform disk. It is important to specify that the continuum half-light radius measured with microlensing is essentially independent of the model adopted to describe the source (Mortonson et al. 2005). The relative probabilities of the different combinations of r1/2 BLR and r1/2 Cont were then computed. Since the posterior probability distributions of log10(r1/2 BLR/r1/2 Cont) are very similar to those obtained for log10(rin BLR/rs Cont) (see Fig. 1), they are not shown. The median values of the probability distributions are given in Table 2. The uncertainties were computed as the equal-tailed credible intervals that enclose a posterior probability of 68%. The median values are plotted in Figs. 2 and 3 as a function of the quasar bolometric luminosity, Lbol, for the sample of 12 [object,line,date] combinations. We emphasize that the continuum sizes were measured at the wavelengths of the emission lines; that is, 1550 Å, 2800 Å, and 6563 Å in the quasar rest frame. It is also important to note that while the BLR and continuum source radii depend on the adopted average microlens mass (usually 0.3 M⊙), their ratio is completely independent of it.
BLR to continuum source radius ratios.
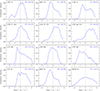 |
Fig. 1. Posterior probability densities of the ratio of the BLR inner radius, rin BLR, over the continuum source outer radius, rs Cont. The object – line (– date) combinations are indicated in the left corners. In the right corners, we give the median values of the probability distributions and their uncertainties (see text). The dotted line indicates where rin BLR = rs Cont. |
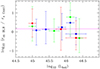 |
Fig. 2. Ratio of the BLR inner to continuum outer radii as a function of the quasar bolometric luminosity. The continuous line shows the sample average. C IV, Mg II, and Hα are illustrated in blue, green, and red, respectively. |
It is immediately clear from Fig. 1 that the majority of the log10(rin BLR/rs Cont) probability distributions are centered on rin BLR ≃ rs Cont. Figure 2 shows that the median values are independent of Lbol. The average of the full sample (12 object+line+date combinations) is log10(rin BLR/rs Cont) = 0.16 ± 0.32, where the quoted uncertainty is the standard deviation. The inner radius of the BLR is thus equal to the outer radius of the continuum source within a factor of two, with possible overlaps. The distributions and median values of log10(r1/2 BLR/r1/2 Cont) show exactly the same behavior, with an offset (Fig. 3). The average of the full sample is log10(r1/2 BLR/r1/2 Cont) = 0.78 ± 0.36, which means that the half-light radius of the BLR is on average a factor of six larger than the half-light radius of the continuum source. It is noteworthy that there is no significant difference between the high- and low-ionization lines, which also means between the continua measured at different wavelengths3. Systematic errors affecting the different lines, if any, would not produce a constant rin BLR/rs Cont ratio, but rather scramble it.
The fact that the ratio of the BLR to continuum size is constant, within the uncertainties, for different quasar luminosities suggests that the BLR and continuum source sizes should change in parallel. We then computed the continuum source radii from the radius ratios we have measured and the BLR radii reported in our previous work (Table 2). The BLR radii are plotted against the continuum source radii in Fig. 5, where a clear correlation can be observed4.
4. Discussion
These results independently confirm the RM findings that the optical continuum source is generally comparable in size to the inner BLR (Fausnaugh et al. 2016; Kara et al. 2021). Moreover, the factor of six between the BLR and the continuum source half-light radii is in excellent agreement with the RM Hβ to 5100 Å time lag ratios reported by Netzer (2022). In this sample, the continuum time lags were measured between the ionizing far-UV and the 5100 Å continua, providing a good estimate of the size of the continuum source at 5100 Å. Our measurements thus extend the RM results, in particular the luminosity independence of the BLR to continuum size ratio, to higher-redshift, higher-luminosity quasars (Fig. 4). The correlation between the BLR and the UV-optical continuum source radii, which is also in excellent agreement with the RM time lags of Netzer (2022) (Fig. 5), supports the idea that the dominant contribution to the UV-optical continuum may originate from the BLR itself, with both the UV-optical continuum and the BELs responding similarly to the ionizing continuum coming from a more compact source5. Remarkably, the correlation holds for lines of different ionization and their underlying continua at different wavelengths, at least for the objects of our sample. In agreement with previous work (Morgan et al. 2010; Blackburne et al. 2011; Cornachione & Morgan 2020), we also found that the half-light radius of the continuum source is, on average, a factor of four larger than the size expected from the standard Shakura-Sunyaev accretion disk (Fig. 6).
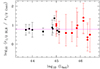 |
Fig. 4. Ratio of the BLR to continuum sizes as a function of the quasar bolometric luminosity. The RM Hβ to 5100 Å time lag ratios from Netzer (2022) are in black (squares). Our microlensing half-light radius ratios are shown in red (diamonds). The continuous line represents the average of our sample. |
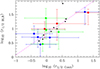 |
Fig. 5. BLR half-light radius as a function of the continuum source half-light radius. C IV, Mg II, and Hα are illustrated in blue, green, and red, respectively. The additional small black squares show the RM measurements considered by Netzer (2022). The dashed line represents the Wang et al. (2023) relation, log10(r1/2 BLR) = 0.759 (log10(r1/2 Cont)−ρ)+1.434, with ρ = 0.8 instead of 0.5. |
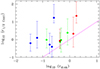 |
Fig. 6. Continuum source half-light radii from this work versus the Shakura-Sunyaev disk radii expected at the observed continuum wavelengths. The latter radii were computed using Eq. (3) of Mosquera & Kochanek (2011) with an accretion efficiency of η = 0.1, and black-hole masses from Sluse et al. (2012), Shalyapin et al. (2021), and Hutsemékers et al. (2023). C IV, Mg II, and Hα are illustrated in blue, green, and red, respectively. The continuous line indicates where log10(r1/2 Cont) = log10(rdisk). |
Various photoionization models (Korista & Goad 2001; Lawther et al. 2018; Chelouche et al. 2019; Korista & Goad 2019; Netzer 2022) have shown that a diffuse continuum emitted in the BLR over the full UV-optical wavelength range can quantitatively reproduce the observed RM continuum time lags, eclipsing the continuum previously thought to be emitted by a standard accretion disk. A similar conclusion was reached by simulating microlensing-based continuum size measurements with a diffuse, extended continuum source (Fian et al. 2023). While RM probes the time lags between the quasar variable components, microlensing, on the other hand, is sensitive to the size of the light-emitting regions.
Although they all agree on the importance of the diffuse continuum coming from the BLR, the models differ in their assumptions about the BLR physics and photoionization. In particular, they can predict different contributions of the diffuse continuum to the total UV-optical continuum, and different wavelength dependences of this contribution. The fact that the correlation between the BLR and the continuum source radii is observed at both 1550 Å and 6563 Å (Fig. 5) suggests that the diffuse continuum contribution could be significant over at least the wavelength range 1550 – 6563 Å. If confirmed with more data and/or smaller uncertainties, such a result could put constraints on the BLR physics.
An extended, non-microlensed continuum source was also found in two lensed broad absorption line quasars, thanks to the differential absorption of the microlensed and non-microlensed continua (Sluse et al. 2015; Hutsemékers et al. 2020). For one quasar, spectropolarimetric observations suggested that the diffuse continuum can be attributed to scattering from an extended region located along the polar axis (Hutsemékers et al. 2015). If the extended continuum source is due to scattering, a correlation between the BLR and the continuum source radii would not be expected. However, the scattering interpretation could only apply to broad absorption line quasars that show prominent winds, and are, on average, more polarized than normal quasars (Stockman et al. 1984; Hutsemékers et al. 1998).
5. Summary and conclusions
We have reported measurements of the ratio of the BLR radius to the UV-optical continuum source radius, for eight lensed quasars and different emission lines (C IV, Mg II, and Hα). These measurements are based on the observed microlensing-induced BEL profile distortions and underlying continuum magnifications, which were simultaneously compared with microlensing simulations. We found that, on average, and independently of the line ionization level and the wavelength of the continuum, the inner radius of the BLR starts at the end of the UV-optical continuum source. We found that the half-light radius of the BLR is, on average, a factor of six larger than the half-light radius of the continuum source, independently of the quasar bolometric luminosity. We also found a correlation between the BLR radius and the continuum source radius, supporting the idea that the dominant contribution to the UV-optical continuum comes from the BLR itself. This correlation involves lines of different ionization with their underlying continua at different wavelengths, suggesting that the contribution of the diffuse UV-optical continuum may be significant over a wide range of wavelengths, although more data with smaller uncertainties would be needed to confirm this. We emphasize that these results are independent of the mass of the microlens. By directly probing the size of light-emitting regions rather than time lags of variable components, our microlensing analysis independently confirms previous RM results, and extends them to higher-redshift, higher-luminosity quasars.
Although currently based on a small sample with rather large uncertainties, our results open interesting perspectives on understanding the nature of the diffuse, extended continuum source in quasars, in relation to the BLR. They complement the results from RM by probing different aspects of the quasar inner regions, the size of the light emitters versus time lags, and for quasars at higher redshifts.
In the following, we use the terms AGN and quasar interchangeably.
In some of our papers, the first ones, we only considered models for which rin ≥ rs to save computing time. This condition was found to have little effect on the determination of the BLR properties. However, it is clear that it had to be relaxed for the present study.
Only Mg II in J1339 seems to have a slightly higher rin BLR/rs Cont ratio, although the difference is not significant given the large error bars.
Fian et al. (2021, 2023) estimated the BLR and the continuum source radii using microlensing in the lensed quasar Q0957+561, which is not in our sample. They found r1/2 BLR≃ 50 light-days for the Mg II BLR and r1/2 Cont≃ 18 light-days for the continuum at 2558 Å. These values follow and support our results (assuming the size of the continuum source at 2800 Å similar to its size at 2558 Å).
Wang et al. (2023) report a relation between the Hβ BLR and the 5100 Å continuum source radii, based on RM measurements that include those of Netzer (2022). With an offset of 0.3 dex toward larger continuum sizes, this relation is in good agreement with both our measurements and those of Netzer (2022) (Fig. 5). The offset could be due to the fact that the Wang et al. (2023) sample also includes objects for which only optical time lags were available, which could bias the continuum source radii toward smaller values. We emphasize that microlensing directly measures sizes, and thus cannot be affected by such a bias.
Acknowledgments
D.H. thanks Mohamad Naddaf for useful discussions on BLR models, and acknowledges support from the Fonds de la Recherche Scientifique – FNRS (Belgium) under grants PDR T.0116.21 and No 4.4503.19.
References
- Blackburne, J. A., Pooley, D., Rappaport, S., & Schechter, P. L. 2011, ApJ, 729, 34 [Google Scholar]
- Braibant, L., Hutsemékers, D., Sluse, D., & Goosmann, R. 2017, A&A, 607, A32 [NASA ADS] [CrossRef] [EDP Sciences] [Google Scholar]
- Cackett, E. M., Chiang, C.-Y., McHardy, I., et al. 2018, ApJ, 857, 53 [NASA ADS] [CrossRef] [Google Scholar]
- Cackett, E. M., Gelbord, J., Li, Y.-R., et al. 2020, ApJ, 896, 1 [NASA ADS] [CrossRef] [Google Scholar]
- Cackett, E. M., Bentz, M. C., & Kara, E. 2021, iScience, 24, 102557 [NASA ADS] [CrossRef] [Google Scholar]
- Chelouche, D., Pozo Nuñez, F., & Kaspi, S. 2019, Nat. Astron., 3, 251 [NASA ADS] [CrossRef] [Google Scholar]
- Cornachione, M. A., & Morgan, C. W. 2020, ApJ, 895, 93 [Google Scholar]
- Fausnaugh, M. M., Denney, K. D., Barth, A. J., et al. 2016, ApJ, 821, 56 [Google Scholar]
- Fian, C., Mediavilla, E., Motta, V., et al. 2021, A&A, 653, A109 [NASA ADS] [CrossRef] [EDP Sciences] [Google Scholar]
- Fian, C., Muñoz, J. A., Mediavilla, E., et al. 2023, A&A, 678, A108 [NASA ADS] [CrossRef] [EDP Sciences] [Google Scholar]
- Hutsemékers, D., & Sluse, D. 2021, A&A, 654, A155 [NASA ADS] [CrossRef] [EDP Sciences] [Google Scholar]
- Hutsemékers, D., Lamy, H., & Remy, M. 1998, A&A, 340, 371 [Google Scholar]
- Hutsemékers, D., Sluse, D., Braibant, L., & Anguita, T. 2015, A&A, 584, A61 [NASA ADS] [CrossRef] [EDP Sciences] [Google Scholar]
- Hutsemékers, D., Braibant, L., Sluse, D., & Goosmann, R. 2019, A&A, 629, A43 [NASA ADS] [CrossRef] [EDP Sciences] [Google Scholar]
- Hutsemékers, D., Sluse, D., & Kumar, P. 2020, A&A, 633, A101 [NASA ADS] [CrossRef] [EDP Sciences] [Google Scholar]
- Hutsemékers, D., Sluse, D., Savić, {D}., & Richards, G. T. 2023, A&A, 672, A45 [NASA ADS] [CrossRef] [EDP Sciences] [Google Scholar]
- Hutsemékers, D., Sluse, D., & Savić, {D}. 2024a, A&A, 687, A153 [NASA ADS] [CrossRef] [EDP Sciences] [Google Scholar]
- Hutsemékers, D., Sluse, D., & Savić, {D}. 2024b, A&A, 691, A292 [NASA ADS] [CrossRef] [EDP Sciences] [Google Scholar]
- Kara, E., Mehdipour, M., Kriss, G. A., et al. 2021, ApJ, 922, 151 [NASA ADS] [CrossRef] [Google Scholar]
- Korista, K. T., & Goad, M. R. 2001, ApJ, 553, 695 [Google Scholar]
- Korista, K. T., & Goad, M. R. 2019, MNRAS, 489, 5284 [CrossRef] [Google Scholar]
- Lawther, D., Goad, M. R., Korista, K. T., Ulrich, O., & Vestergaard, M. 2018, MNRAS, 481, 533 [NASA ADS] [CrossRef] [Google Scholar]
- Morgan, C. W., Kochanek, C. S., Morgan, N. D., & Falco, E. E. 2010, ApJ, 712, 1129 [Google Scholar]
- Mortonson, M. J., Schechter, P. L., & Wambsganss, J. 2005, ApJ, 628, 594 [NASA ADS] [CrossRef] [Google Scholar]
- Mosquera, A. M., & Kochanek, C. S. 2011, ApJ, 738, 96 [Google Scholar]
- Netzer, H. 2013, The Physics and Evolution of Active Galactic Nuclei [Google Scholar]
- Netzer, H. 2022, MNRAS, 509, 2637 [NASA ADS] [Google Scholar]
- Pei, L., Fausnaugh, M. M., Barth, A. J., et al. 2017, ApJ, 837, 131 [NASA ADS] [CrossRef] [Google Scholar]
- Peterson, B. M. 1997, An Introduction to Active Galactic Nuclei [Google Scholar]
- Savić, {D}., Hutsemékers, D., & Sluse, D. 2024, A&A, 687, A114 [NASA ADS] [CrossRef] [EDP Sciences] [Google Scholar]
- Shalyapin, V. N., Goicoechea, L. J., Morgan, C. W., Cornachione, M. A., & Sergeyev, A. V. 2021, A&A, 646, A165 [NASA ADS] [CrossRef] [EDP Sciences] [Google Scholar]
- Sluse, D., Hutsemékers, D., Courbin, F., Meylan, G., & Wambsganss, J. 2012, A&A, 544, A62 [NASA ADS] [CrossRef] [EDP Sciences] [Google Scholar]
- Sluse, D., Hutsemékers, D., Anguita, T., Braibant, L., & Riaud, P. 2015, A&A, 582, A109 [NASA ADS] [CrossRef] [EDP Sciences] [Google Scholar]
- Stockman, H. S., Moore, R. L., & Angel, J. R. P. 1984, ApJ, 279, 485 [NASA ADS] [CrossRef] [Google Scholar]
- Urry, C. M., & Padovani, P. 1995, PASP, 107, 803 [NASA ADS] [CrossRef] [Google Scholar]
- Vernardos, G., Sluse, D., Pooley, D., et al. 2024, Space Sci. Rev., 220, 14 [NASA ADS] [CrossRef] [Google Scholar]
- Wandel, A., Peterson, B. M., & Malkan, M. A. 1999, ApJ, 526, 579 [NASA ADS] [CrossRef] [Google Scholar]
- Wang, S., Guo, H., & Woo, J.-H. 2023, ApJ, 948, L23 [NASA ADS] [CrossRef] [Google Scholar]
All Tables
All Figures
|
Fig. 1. Posterior probability densities of the ratio of the BLR inner radius, rin BLR, over the continuum source outer radius, rs Cont. The object – line (– date) combinations are indicated in the left corners. In the right corners, we give the median values of the probability distributions and their uncertainties (see text). The dotted line indicates where rin BLR = rs Cont. |
| In the text | |
|
Fig. 2. Ratio of the BLR inner to continuum outer radii as a function of the quasar bolometric luminosity. The continuous line shows the sample average. C IV, Mg II, and Hα are illustrated in blue, green, and red, respectively. |
| In the text | |
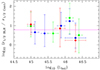 |
Fig. 3. Same as Fig. 2, but for the ratio of the BLR to continuum half-light radii. |
| In the text | |
|
Fig. 4. Ratio of the BLR to continuum sizes as a function of the quasar bolometric luminosity. The RM Hβ to 5100 Å time lag ratios from Netzer (2022) are in black (squares). Our microlensing half-light radius ratios are shown in red (diamonds). The continuous line represents the average of our sample. |
| In the text | |
|
Fig. 5. BLR half-light radius as a function of the continuum source half-light radius. C IV, Mg II, and Hα are illustrated in blue, green, and red, respectively. The additional small black squares show the RM measurements considered by Netzer (2022). The dashed line represents the Wang et al. (2023) relation, log10(r1/2 BLR) = 0.759 (log10(r1/2 Cont)−ρ)+1.434, with ρ = 0.8 instead of 0.5. |
| In the text | |
|
Fig. 6. Continuum source half-light radii from this work versus the Shakura-Sunyaev disk radii expected at the observed continuum wavelengths. The latter radii were computed using Eq. (3) of Mosquera & Kochanek (2011) with an accretion efficiency of η = 0.1, and black-hole masses from Sluse et al. (2012), Shalyapin et al. (2021), and Hutsemékers et al. (2023). C IV, Mg II, and Hα are illustrated in blue, green, and red, respectively. The continuous line indicates where log10(r1/2 Cont) = log10(rdisk). |
| In the text | |
Current usage metrics show cumulative count of Article Views (full-text article views including HTML views, PDF and ePub downloads, according to the available data) and Abstracts Views on Vision4Press platform.
Data correspond to usage on the plateform after 2015. The current usage metrics is available 48-96 hours after online publication and is updated daily on week days.
Initial download of the metrics may take a while.