Open Access
Fig. A.1.
Download original image
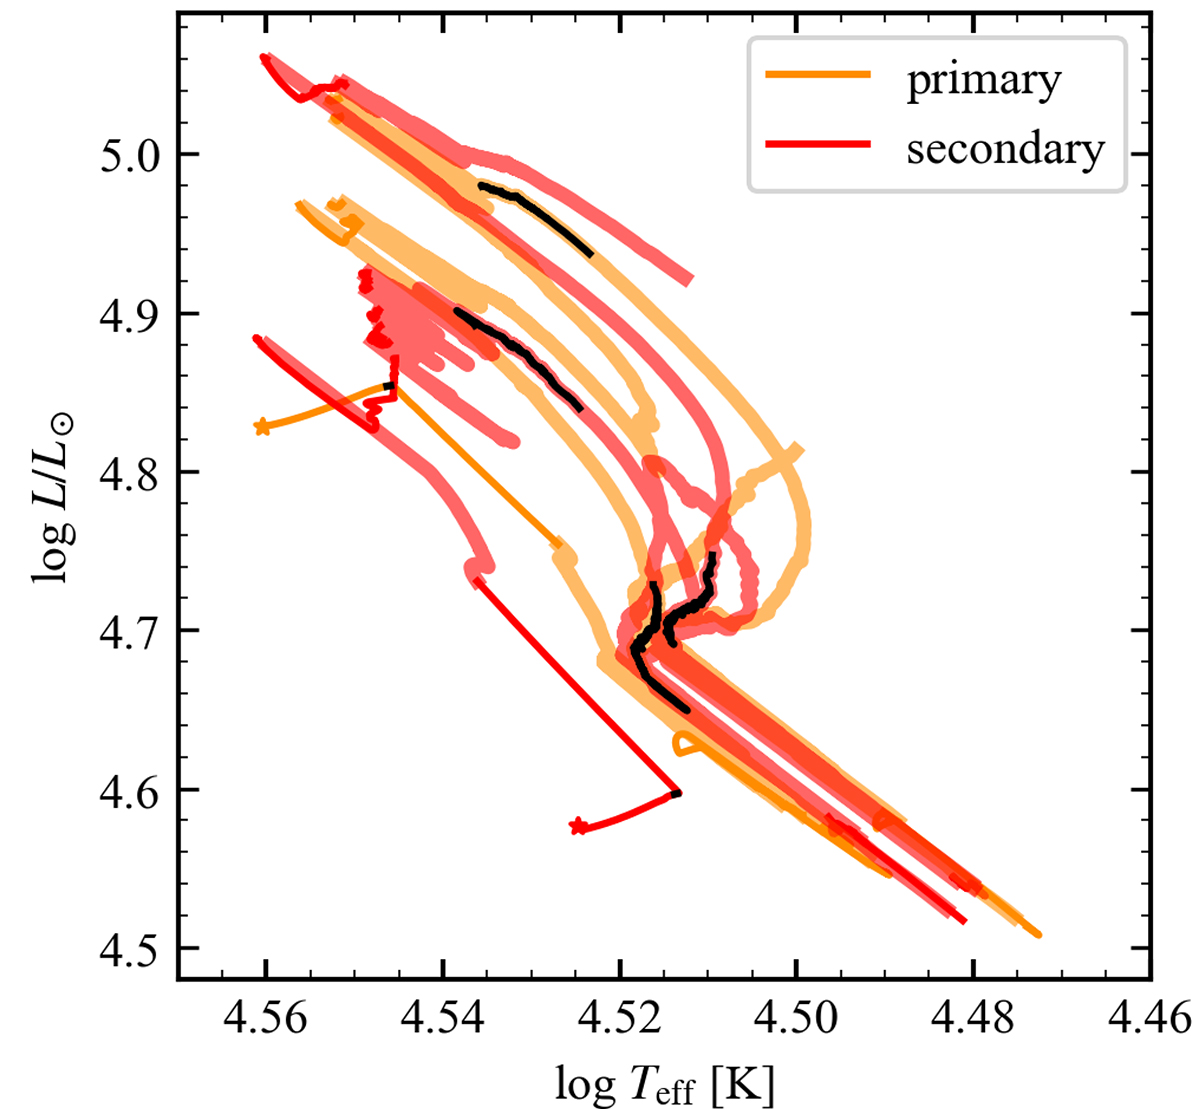
HR diagram of the model presented in Sect. 4.1 for both the primary (orange) and the secondary (red). The contact phases are shown with a lower opacity. The ZAMS is highlighted by a star. The black lines denote the three mass transfer events approximating thermal mass transfer rate.
Current usage metrics show cumulative count of Article Views (full-text article views including HTML views, PDF and ePub downloads, according to the available data) and Abstracts Views on Vision4Press platform.
Data correspond to usage on the plateform after 2015. The current usage metrics is available 48-96 hours after online publication and is updated daily on week days.
Initial download of the metrics may take a while.