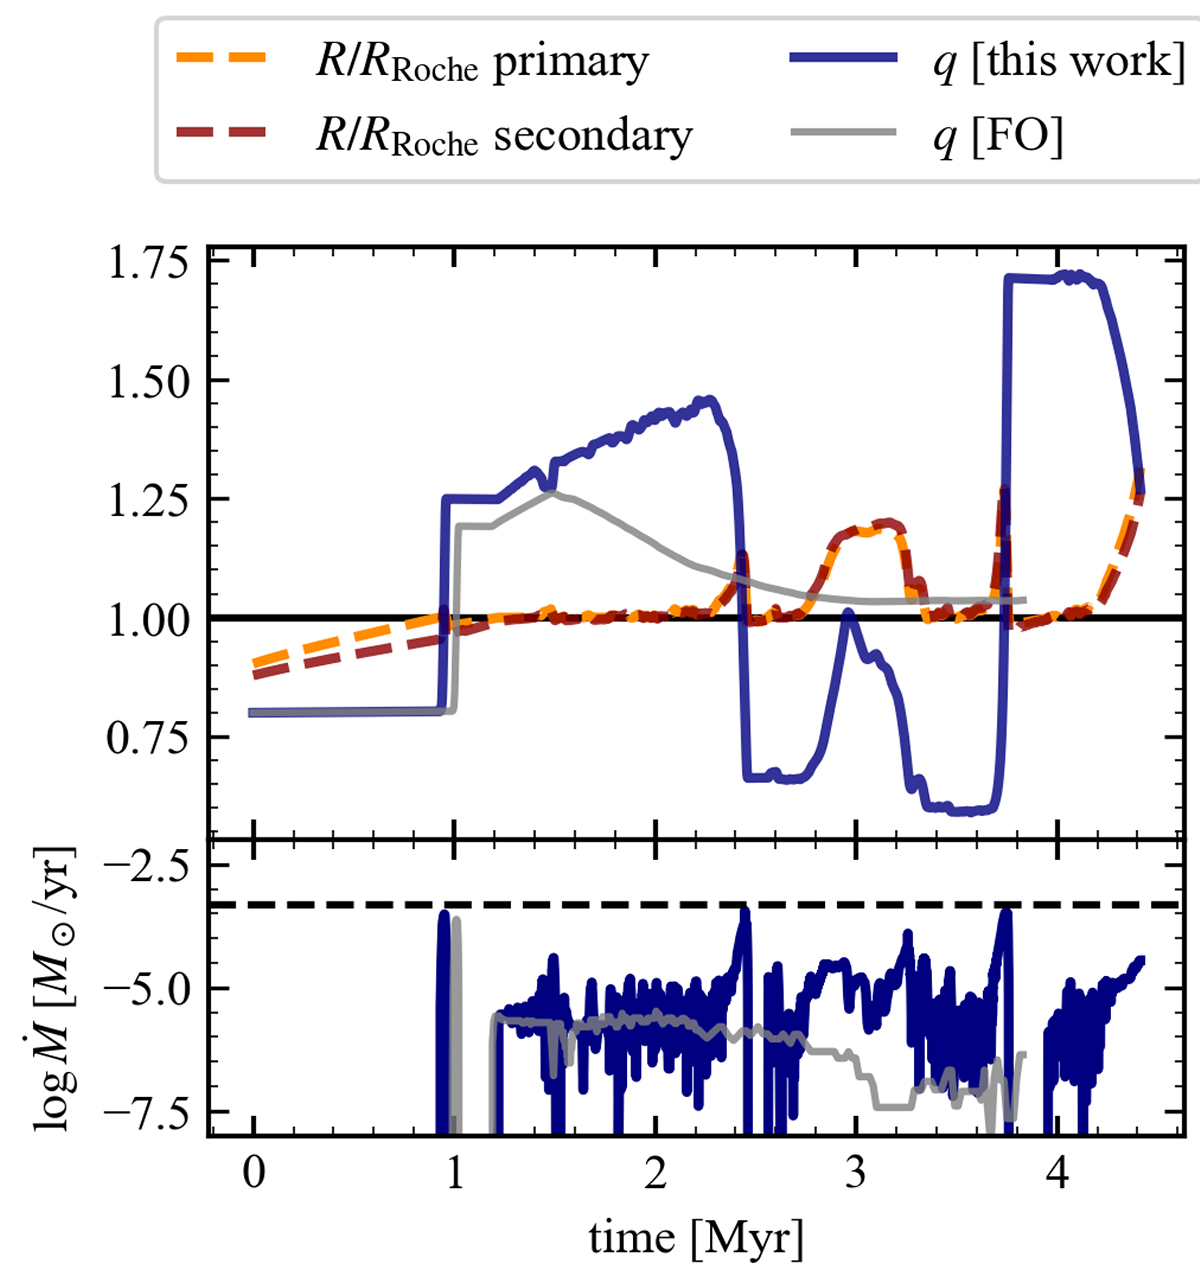
Fig. 1.
Download original image
Example of the mass ratio evolution with initial conditions of M1, initial = 24 M⊙, Pinitial = 1.377 d, and qinitial = 0.8. Top panel: Mass ratio evolution of the system. The coloured lines show the new model, the grey line shows the FO mass ratio evolution. The dashed lines show the stellar radii normalized by the respective Roche lobe radii. Bottom panel: Mass transfer rate of the system of the new model (blue) and the FO model (grey). The dashed black line denotes the initial thermal mass transfer rate of the secondary.
Current usage metrics show cumulative count of Article Views (full-text article views including HTML views, PDF and ePub downloads, according to the available data) and Abstracts Views on Vision4Press platform.
Data correspond to usage on the plateform after 2015. The current usage metrics is available 48-96 hours after online publication and is updated daily on week days.
Initial download of the metrics may take a while.