Fig. 9.
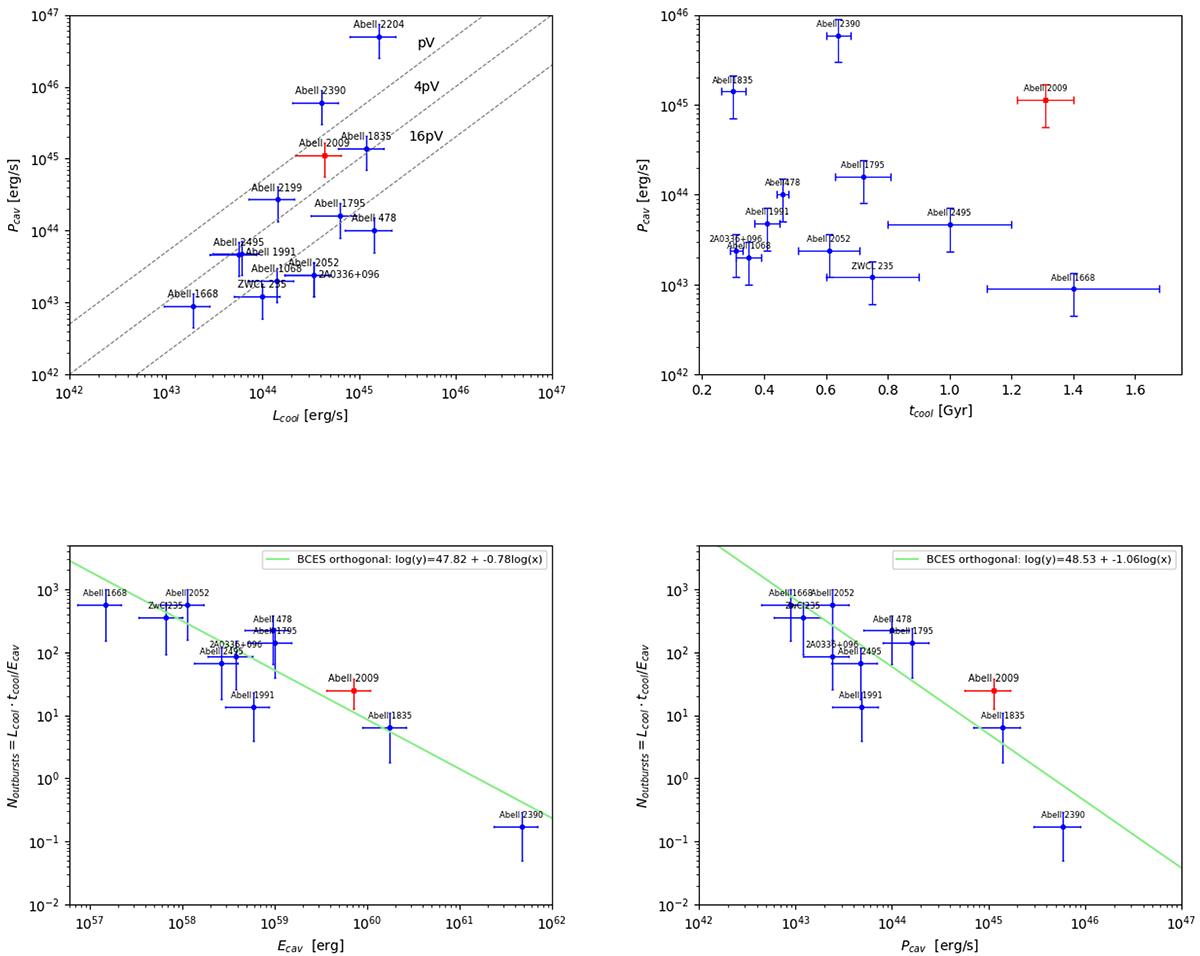
Download original image
Correlation between ICM and AGN properties for the galaxy clusters reported in Table 1. Upper left panel: Cavities power as function of the X-ray luminosity inside the cooling radius of each galaxy cluster. The diagonal lines indicate Pcav = Lcool assuming different values for the adiabatic index γ. All the uncertainties are set to 50% for consistency. Upper right panel: Cavity power as a function of the cooling time at 12 kpc from the clusters center. All the uncertainties on the cavity power are set to 50%, while the errors associated with the cooling time are reported in Table 1. Lower left panel: Number of outbursts required to counterbalance the radiative losses of the cooling gas as a function of the cavity energy. The green line represents the best-fit line derived using the BCES orthogonal regression method. All the uncertainties on the cavity energy and cooling luminosity are set to 50%, while the errors associated with the cooling time are reported in Table 1. Lower right panel: Number of outbursts required to counterbalance the radiative losses of the cooling gas as a function of the cavity power. The green line represents the best-fit line derived using the BCES orthogonal regression method. All the uncertainties on the cavity energy, cavity power and cooling luminosity are set to 50%, while the errors associated with the cooling time are reported in Table 1.
Current usage metrics show cumulative count of Article Views (full-text article views including HTML views, PDF and ePub downloads, according to the available data) and Abstracts Views on Vision4Press platform.
Data correspond to usage on the plateform after 2015. The current usage metrics is available 48-96 hours after online publication and is updated daily on week days.
Initial download of the metrics may take a while.