| Issue |
A&A
Volume 631, November 2019
|
|
|---|---|---|
| Article Number | A22 | |
| Number of page(s) | 33 | |
| Section | Extragalactic astronomy | |
| DOI | https://doi.org/10.1051/0004-6361/201935350 | |
| Published online | 15 October 2019 | |
Ubiquitous cold and massive filaments in cool core clusters
1
LERMA, Observatoire de Paris, PSL Research Univ., CNRS, Sorbonne Univ., 75014 Paris, France
e-mail: This email address is being protected from spambots. You need JavaScript enabled to view it.
2
Collège de France, 11 Place Marcelin Berthelot, 75005 Paris, France
3
Institute of Astronomy, University of Cambridge, Madingley Road, Cambridge CB1 0HA, UK
4
Sorbonne Université, CNRS, UMR7095, Institut d’Astrophysique de Paris, 98 bis Bd Arago, 75014 Paris, France
5
Institut Universitaire de France, Ministère de l’Education Nationale, de l’Enseignement Supérieur et de la Recherche, 1 Rue Descartes, 75231 Paris Cedex 05, France
6
Ecole Normale Supérieure, PSL Research Univ., CNRS, 75005 Paris, France
7
Physics & Astronomy Department, Michigan State University, East Lansing, MI 48824-2320, USA
8
Harvard-Smithsonian Center for Astrophysics, 60 Garden St., Cambridge, MA 02138, USA
9
Kavli Institute for Particle Astrophysics and Cosmology (KIPAC), Stanford University, 452 Lomita Mall, Stanford, CA 94305-4085, USA
10
University of Manitoba, Department of Physics and Astronomy, Winnipeg, MB R3T 2N2, Canada
11
Centre for Extragalactic Astronomy, Durham University, DH1 3LE Durham, UK
12
Department of Physics and Astronomy, University of Kentucky, Lexington, Kentucky 40506-0055, USA
13
Université Cote d’Azur, Observatoire de la Cote d’Azur, CNRS, Laboratoire Lagrange, Bd de l’Observatoire, CS 34229, 06304 Nice Cedex 4, France
Received:
23
February
2019
Accepted:
22
July
2019
Abstract
Multi-phase filamentary structures around brightest cluster galaxies (BCG) are likely a key step of AGN-feedback. We observed molecular gas in three cool cluster cores, namely Centaurus, Abell S1101, and RXJ1539.5, and gathered ALMA (Atacama Large Millimeter/submillimeter Array) and MUSE (Multi Unit Spectroscopic Explorer) data for 12 other clusters. Those observations show clumpy, massive, and long (3−25 kpc) molecular filaments, preferentially located around the radio bubbles inflated by the AGN. Two objects show nuclear molecular disks. The optical nebula is certainly tracing the warm envelopes of cold molecular filaments. Surprisingly, the radial profile of the Hα/CO flux ratio is roughly constant for most of the objects, suggesting that (i) between 1.2 and 6 times more cold gas could be present and (ii) local processes must be responsible for the excitation. Projected velocities are between 100 and 400 km s−1, with disturbed kinematics and sometimes coherent gradients. This is likely due to the mixing in projection of several thin (and as yet) unresolved filaments. The velocity fields may be stirred by turbulence induced by bubbles, jets, or merger-induced sloshing. Velocity and dispersions are low, below the escape velocity. Cold clouds should eventually fall back and fuel the AGN. We compare the radial extent of the filaments, rfil, with the region where the X-ray gas can become thermally unstable. The filaments are always inside the low-entropy and short-cooling-time region, where tcool/tff < 20 (9 of 13 sources). The range of tcool/tff of 8−23 at rfil, is likely due to (i) a more complex gravitational potential affecting the free-fall time tff (sloshing, mergers, etc.) and (ii) the presence of inhomogeneities or uplifted gas in the ICM, affecting the cooling time tcool. For some of the sources, rfil lies where the ratio of the cooling time to the eddy-turnover time, tcool/teddy, is approximately unity.
Key words: galaxies: clusters: general / galaxies: clusters: intracluster medium / galaxies: jets / galaxies: kinematics and dynamics / submillimeter: galaxies
© V. Olivares et al. 2019
 Open Access article, published by EDP Sciences, under the terms of the Creative Commons Attribution License (http://creativecommons.org/licenses/by/4.0), which permits unrestricted use, distribution, and reproduction in any medium, provided the original work is properly cited.
1. Introduction
The cores of galaxy clusters are very dynamic and host some of the most energetic active galactic nuclei (AGNs) known in the local universe. Brightest cluster galaxies (BCGs) located at the centers of galaxy clusters, are the largest, most luminous, and massive elliptical galaxies in the Universe. These BCGs have extended, diffuse stellar envelopes and predominantly old “red and dead stellar” populations.
Deep X-ray observations of the central regions of clusters show intense X-ray emission suggesting that the intra-cluster medium (ICM) is cooling radiatively. This rapidly cooling gas should condense into cold gas clouds and/or form stars on short timescales relative to the age of the cluster (e.g., Fabian 1994; Fabian et al. 2002). However, the cold gas mass and star formation rates observed are too low to be consistent with the mass of gas that is predicted to be cooling from the ICM, suggesting that some form of heating balances the radiative cooling. Mechanical and radiative heating from AGNs is the most widely accepted scenario for preventing rapid cooling of the ICM and this notion is supported by observations of obvious interaction between the radio–jets and the high-filling-factor gas within the ICM. For example, X-ray images clearly show that super massive black holes (SMBH) strongly interact with their cluster environments, generating outflows or jets, bubbles, turbulence, and shocks that heat the surrounding hot atmosphere thermally and dynamically (e.g., McNamara & Nulsen 2007; Fabian 2012, for a review).
Recent theoretical analyses and simulations have suggested that the hot atmospheres can become thermally unstable locally when the ratio of the cooling to free-fall timescales, tcool/tff, falls below ∼10−20 (McCourt et al. 2012; Gaspari et al. 2012; Prasad et al. 2015; Voit & Donahue 2015; Li et al. 2015; McNamara et al. 2016; Voit et al. 2015, 2017). In this model, the condensed cold gas rains down on the central supermassive black hole (SMBH), fuelling it. The SMBH, then an actively accreting AGN, injects the energy back in the form of massive outflows, often entrained by relativistic jets, establishing a tight self-regulated loop (a feedback loop driven by an AGN or “AGN feedback”; Gaspari & Sądowski 2017). Molecular gas observations in the central region of clusters have shown that cold filaments extend along the trajectories of the radio bubbles or around the X-ray cavities (Salomé & Combes 2004; Salomé et al. 2006; David et al. 2014; McNamara et al. 2014; Russell et al. 2014, 2016, 2017a; Tremblay et al. 2016; Vantyghem et al. 2016, 2018). The molecular clouds have likely cooled in-situ by either (i) low-entropy gas that has been uplifted by the bubbles to an altitude where it becomes thermally unstable or (ii) direct thermal instability of small perturbation in the hot halo (see the introduction of Tremblay et al. 2018 for a detailed description of the different scenarios).
In this paper we present Atacama Large Millimeter Array (ALMA) Cycle 3 observations that map the kinematics and morphology of the cold molecular gas phase of three well-studied BCGs, Centaurus (also known as NGC 4696), Abell S1101 (so-called Sersic 159−03), and RXJ1539.5−8335, traced by CO(1-0) emission. In addition, we include a revised analysis of the ALMA observations of 12 BCGs: PKS 0745−191, Abell 1664, Abell 1835, Abell 2597, M 87, Abell 1795, Phoenix-A, RXJ0820.9+0752, 2A0335+096, Abell 3581, Abell 262 and Hydra-A. We compare ALMA observations with new Multi-Unit Spectroscopic Explorer (MUSE) IFU (Integral Field Units) data that maps the kinematics and morphology of the warm ionized gas. The ALMA sample is described in Sect. 2, while the MUSE and ALMA data are described in Sect. 3. Results are presented in Sect. 4, discussed in Sect. 5, and summarized in Sect. 6. We assume a standard cosmology throughout with H0 = 70 km s−1 Mpc−1 and Ωm = 0.3.
2. Sample
The 15 cool-core BCGs with z < 0.6 that comprise our sample are listed in Table 1, and split into two groups: (1) those with new ALMA observations and (2) those for which we used ALMA archive data. All are well-studied and have nearly complete spectral data coverage from the radio to the X-ray. Our new ALMA observations sample presented here include three well-known BCGs: Centaurus, RXJ1539.5−8335, and Abell S1101. All three are known to have extended optical emission nebulae. Furthermore, we describe in depth the three galaxies for which we have obtained CO(1-0) data. We adopted distances of 49.5, 261, and 331.1 Mpc for Centaurus, Abell S1101, and RXJ1539, respectively, which then yield physical scales of 0.208, 1.437, and 1.094 kpc arcsec−1, respectively. In order to build a more complete picture of cool-core clusters, we have included a complementary sample of twelve BCGs from the ALMA archive. These are the only BCGs that are known to have at least one detection in CO(1-0), CO(2-1), and/or CO(3-2) (as indicated specifically in Table 1), making this the largest sample of such BCGs with ALMA coverage. Each of these clusters has a central cooling time of less than 1 × 10⁹ yr and all have been observed in Hα. Throughout the rest of this paper we refer to the central galaxies by the names of the clusters in which they lie (Table 1).
Sample: ALMA and MUSE data used in our analysis.
Our sample spans a wide range of X-ray classical mass deposition rates (measured from X-ray density profiles) and star-formation rates (SFRs), Balmer and forbidden line luminosities, and in the power of their AGN, radio sources, and X-ray cavities. Our sample of sources spans from high to low SFR and strong to weak signatures of AGN feedback. A summary of these various properties can be found in Table 6. In the following paragraphs, we describe in detail the three ALMA sources for which we obtained new ALMA observations.
Centaurus. NGC 4696, at z = 0.0114, is the brightest galaxy of the Centaurus cluster of galaxies, Abell 3526, and is one of the X-ray brightest and nearest galaxy clusters in the sky. Chandra observations of the cluster revealed a plume-like structure of soft X-ray emission extending from the nucleus (Sanders & Fabian 2002; Sanders et al. 2016). Optical observations reveal bright line-emitting dusty filaments in Hα and [NII] (Fabian et al. 1982, 2016). These filaments extend over the central arcminute (∼14 kpc; Sparks et al. 1989; Crawford et al. 2005) and have approximately the same morphology as the spiral structure observed in the X-ray. They also show a remarkable spatial correlation with the dust features, in particular the dust sweeping around the core of the galaxy to the south and west, looping around the core of the NGC 4696 (Sparks et al. 1989; Laine et al. 2003). NGC 4696 hosts a compact steep-spectrum FR I-type radio source, PKS 1246−410 (spectral index of 1.75; Werner et al. 2011), with a total radio luminosity of 3.0 × 10²³ W Hz−1 and a core power radio luminosity of 2.0 × 10²¹ W Hz−1 at 5 GHz (Taylor et al. 2006). Typical radio galaxies have GHz radio powers > 1022 W Hz−1 (Ledlow & Owen 1996). Observations with the VLA indicate that the extended component of the central radio source appears to be interacting with and displacing the ICM and that it has excavated small cavities in the X-ray gas (Taylor et al. 2002, 2006). Mittal et al. (2011) measured two of the strongest cooling lines of the interstellar medium (ISM), namely [CII]157.74 μm and [OI]63.18 μm. The [CII] emission has a similar morphology and velocity structure to the Hα emission. In addition, these latter authors found 1.6 × 10⁶ M⊙ of dust at 19 K, although the low far-infrared (FIR) luminosity suggests a SFR of only 0.13 M⊙ yr−1. In this paper, we present an analysis of the molecular gas maps from CO(1-0) Cycle 3 ALMA observations of the Centaurus cluster.
RXJ1539.5−8335. The cluster RXJ1539.5−8335 (BCG: 2MASX J15393387−8335215) is the most distant of our three targets, z = 0.0728, but is the most luminous in Hα. It has bright clumpy filaments in Hα that extend to the east and west of the BCG over the central arcminute (∼83.7 kpc) and has disturbed morphology and velocity field (Hamer et al. 2016). Hogan et al. (2015) showed that the source has a flat spectrum, with a spectral index of 0.45 ± 0.07, and is core-dominated. The X-ray morphology is extended and bar-like in the core of the cluster which is qualitatively similar to the observed Hα morphology. We note that no radio jets have been observed in this source.
Abell S1101. Abell S1101 (Sersic 159−03) is a relatively low-mass cool-core moderately distant cluster, z = 0.058, that has been the subject of many studies. The central dominant galaxy of the cluster reveals a complex structure at all wavelengths and shows dust lanes, molecular gas, excess UV emission, and a bright Hα+[NII] filamentary nebula of 44 kpc in length that is associated with low-entropy, high-metallicity, cooling X-ray-emitting gas (Oonk et al. 2010; Werner et al. 2011; Farage et al. 2012; McDonald et al. 2012). The mass of cold dust in the center of the cluster is ∼107 M⊙ (McDonald et al. 2015). This cluster shows signs of strong AGN feedback. The radio source has a very steep power-law spectrum, α ∼−2.2, and is extended to the east, northeast, and northwest of the core. The radio emission from the core is flatter than the more extended radio emission (α ∼ −1 to −1.5; Bîrzan et al. 2004; Werner et al. 2011). The radio lobes seen at 5 GHz and 8.5 GHz are extended over ∼10 kpc and are aligned with the filaments and southern cavity (Bîrzan et al. 2004, 2008; Werner et al. 2011). The total radio power of Abell S1101 is 1.7 × 1024 W Hz−1 at 1.4 GHz (Bîrzan et al. 2008; Oonk et al. 2010). Multi-wavelength studies of the cluster core have found evidence for strong interaction between the jet and hot gas (e.g., Werner et al. 2010; Farage et al. 2012). These studies suggest the emission line gas is uplifted from the central galaxy by the jets and lobes which have also removed most of the cooling X-ray gas. Moreover, Farage et al. (2012) note that the kinematics of the Hα emission line gas are consistent with both infall and outflow.
3. Observations and data reduction
3.1. ALMA data reduction
The BCGs Centaurus, RXJ1539.5−8335, and Abell S1101 were observed in band 3 with ALMA as a Cycle 3 program (ID = 2015.1.01198.S; PI: S. Hamer). The Centaurus data were obtained in two sets of observations of 40 min on 27 January 2016; RXJ1539.5−8335 was observed during two sessions of 26 min each on 6 March 2016 and Abell S1101 data was obtained in two runs of 48 min observations on 26 January 2016; see Table 2. On average, forty-four 12 m antennas were used in the compact configuration with baseline 15−312 m. The observations used a single pointing centered on the BCGs in each cluster. The frequency division correlator mode was used with a 8 GHz bandwidth and frequency resolution of 3.9 kHz (∼5 km s−1) for Centaurus and 1.9 kHz (∼5 km s−1) for both RXJ1539.5−8335 and Abell S1101. Channels were binned together to improve the signal-to-noise ratio (S/N). The precipitable water vapor (PWV) was 2.46, 3.0, and 2.36 mm for the observations taken on 26 and 27 January and on 3 March, 2016, respectively. The flux calibrators were J1107−4449 and J1427−4206 for Centaurus, whereas Titan and Neptune were used for the observations of RXJ1539.5−8335 and Abell S1101, respectively. The observations were calibrated using the Common Astronomy Software Application (CASA) software (version 4.5.1, McMullin et al. 2007) following the processing scripts provided by the ALMA science support team. To make channel maps suitable for our own needs, first we performed the continuum subtraction where the level of the continuum emission was determined from line-free channels and subtracted from visibilities using the task UVCONTSUB. The calibrated continuum-subtracted visibilities were then imaged and deconvolved with the CLEAN algorithm. We found that self-calibration did not produce a significant reduction in the rms noise of the final image. To find the optimal S/N, we made several channel maps with different velocity resolution and with natural weighting using the Hogbom method. The final data for Centaurus has a 2.90″ × 2.14″ synthesized beam with a PA = 81.5 deg and the rms noise level is 0.43 mJy beam−1 for a velocity resolution of 30 km s−1. For RXJ1539.5−8335, the rms noise level was 0.41 mJy beam−1 for a velocity resolution of 30 km s−1 and a synthesized beam of 2.20″ × 1.85″ with a PA = 11.7 deg. Finally, the Abell S1101 data cube has an rms noise level of 0.44 mJy beam−1 for a velocity width of 30 km s−1 and a synthesized beam of 2.20″ × 1.80″ with a PA = 66.2 deg. Images of the continuum emission were also produced using CLEAN task of CASA by averaging channels free of any line emission. Continuum images of the flux calibrators were performed in order to test the veracity of the flux and measure the uncertainty. To do this, we compared the flux measurements with the flux computed at the same frequency on a similar date to that of the observations using the SMA calibrator catalog. ALMA archived data were processed following the processing script provided by the ALMA science support team and using the CASA version that they suggest. In particular, we followed the CASA guides to modify the packaged calibration script in order to apply the proper amplitude calibration scale (which has changed since Cycle 0). The imaging and the continuum subtraction procedure were the same as for new ALMA observations described before. In Table 2 lists the rms sensitivities and the angular resolutions for the ALMA archive data. As each observation is described in detail in the references listed in Tables 2 and 1, we only summarize the main characteristics of these observations.
ALMA observation properties.
3.2. MUSE optical integral field spectroscopy
We also present new optical nebular emission line kinematics and morphologies for 11 sources in our sample from an analysis of data obtained with the Multi-Unit Spectroscopic Explorer (MUSE). These sources are Centaurus, RXJ1539.5−8335, Abell S1101, PKS 0745−191, Abell 2597, Abell 1795, RXJ0820.9+0752, 2A0335+096, Abell 3581, and Hydra-A. MUSE is an optical image slicing integral field unit (IFU) with a wide field of view (FOV) which is mounted on UT4 of the European Southern Observatory Very Large Telescope (ESO-VLT). The data were obtained as part of the ESO programme 094.A-0859(A); PI: S. Hamer. The observations where carried out in MUSE seeing limited WFM-NOAO-N configuration with a FOV of 1′ × 1′ covering the entire BCG in a single pointing and with an on-source integration time of 900 s.
The data were reduced using version 1.6.4 of the MUSE pipeline Weilbacher et al. (2014), including a bias subtraction, wavelength and flux calibration, illumination correction, flat-fielding, and correction for differential atmospheric diffraction. In addition to the sky subtraction in the pipeline, we performed an additional sky subtraction using ZAP (Zurich Atmosphere Purge; Soto et al. 2016). The final MUSE data cube maps the entire galaxy in the range 4750 @@@ < λ < 9300 Å with a spectral resolution of 1.5 Å.
We created higher-level MUSE data products by modeling the stellar and nebular components of each galaxy. To separate the nebular emission from underlying stellar continuum, we did full-spectral fitting using the PLATEFIT code (Tremonti et al. 2004). First, we determined the redshift of the stellar component using the AUTOZ code, which determines redshifts using cross-correlations with template spectra (Baldry et al. 2014). The stellar velocity dispersion is determined using VDISPFIT. This code uses a set of eigenspectra, convolved for different velocity dispersions. From this, the best-fit velocity dispersion is determined. This value is the observed value and is not corrected for the contribution from the instrumental velocity dispersion (spectral resolution).
For the spectral fitting we use the PLATEFIT spectral-fitting routine. PLATEFIT, which was developed for the SDSS, fits the stellar continuum and emission lines separately. In this continuum fitting stage, regions including possible emission lines are masked out. The stellar continuum is fitted with a collection of the stellar population synthesis model templates of simple stellar populations (Bruzual & Charlot 2003). The template fit is performed using the previously derived redshift and velocity dispersion. The second PLATEFIT emission-line fitting stage is then performed on the residual spectrum, that is, after continuum subtraction. Each of the emission lines are modeled as a single Gaussian profile. All emission lines share a common velocity offset and a common velocity dispersion which are treated as free parameters in the fit. For this paper, we make a requirement that all our emission-line flux measurements have S/N > 3. We also corrected the data cubes for Galactic foreground extinction estimated from the Schlafly & Finkbeiner (2011) recalibration of the Schlegel et al. (1998) IRAS+COBE Milky Way dust map assuming RV = 3.1.
All ALMA and MUSE velocity maps shown in this work are measured in the same reference frame of the stellar systemic velocity of each system. These velocities are taken from published redshifts as described in Table 1. Using PLATEFIT, the optical emission velocities of the Hα emission lines are measured relative to that of the “local stellar continuum” estimated in each pixel (see Fig. 16 of Hamer et al. 2018), and therefore the reference frame may change from one pixel to another. In order to have a consistent absolute reference frame, all the Hα velocities were shifted to a single systemic velocity: the one given in Table 1.
4. Results
4.1. ALMA Continuum in RXCJ1539.5−8335, Abell S1101, and Centaurus
A continuum source is detected in band 3 in RXJ1539.5, Abell S1101, and Centaurus. The continuum is partially resolved for all sources but dominated by a bright point source (Fig. 1). The continuum map extents are ∼10″ and ∼5.5″ (13 kpc and 6 kpc) for RXJ1539.5 and Abell S1101, respectively, and ∼26″ (5.5 kpc) for Centaurus. The location of the continuum source of Abell S1101 is consistent with the 1.46 GHz Very Large Array (VLA) radio position. The mm-continuum source position and morphology of Centaurus also coincides with the radio emission at 8.33 GHz. The total continuum emission in Centaurus has a flux density of 40.9 mJy. No radio image is available for RXJ1539.5.
 |
Fig. 1. ALMA continuum observations of Centaurus (114 GHz), RXJ1539.5−8335 (107 GHz), and Abell S1101 (109 GHz). The black contours are relative to rms noise in each of the data sets and were set to: 3σ, 10σ, 25σ, 50σ, 100σ, 200σ, and 300σ. The beam is plotted in white at the bottom left side of each panel. The red contours indicate the radio emission from the VLA observations at 1.58 GHz (L-band; 0.57 kpc resolution) for Centaurus and 1.46 GHz (L-band; 6 kpc resolution) for Abell S1101. The mm continuum maps are dominated by the synchrotron emission from the AGN at the galaxy center. |
The continuum maps are dominated by a mm synchrotron continuum point source associated with the AGN at the galaxy center, with flux density at 3 mm of 9.3 mJy for RXJ1539.5, 2.2 mJy for S1101, and 37.8 mJy for Centaurus (see Table 3). We fitted a power law to the radio spectral energy distribution (SED) using measurements from VLA and ATCA (Hogan et al. 2015) plus our ALMA observations. The form of the power law was fυ ∝ υ−α and we derived α ∼ 0.9 for Centaurus, α ∼ 1.2 for Abell S1101, and a flat-spectrum for RXJ1539.5 with α ∼ 0.4. We do not detect any CO absorption features in bins from 4 to 50 km s−1 (e.g., David et al. 2014; Tremblay et al. 2016; Rose et al. 2019) against the nuclear continuum in those three systems.
ALMA continuum properties.
4.2. Molecular and ionized warm gas in RXCJ1539.5-8335, Abell S1101, and Centaurus
Figure 2 shows the continuum-subtracted integrated CO(1-0) line and Hα flux distributions of Centaurus, RXCJ1539.5−8335, and Abell S1101. The cold molecular emission is located where the Hα emission is the strongest. The molecular filaments are co-spatial in projection with the warm ionized gas, similar to what has been found in other cool core BCGs (Salomé et al. 2006; Russell et al. 2014; McNamara et al. 2014, 2016; Vantyghem et al. 2016; Tremblay et al. 2016, 2018; Hatch et al. 2005; Lim et al. 2012). In these three sources, the molecular gas is not as extended as the warm ionized gas. This is likely due to the limit in sensitivity of the ALMA observations to low surface brightness gas rather than being due to a true absence of cold molecular gas. We note that the ALMA and MUSE data cover similar areas in each source; for example for Centaurus the FOV (MUSE) is ∼12 kpc (1′), while the HPBW (Half Power Beamwidth) of ALMA at 115.3 GHz is ∼9.5 kpc (46″). The CO, like the Hα emission distribution, shows very bright central emission with the addition of several more diffuse and filamentary structures. We note that secondary bright CO and Hα spots also appear inside the filaments, particularly in Centaurus and Abell S1101.
 |
Fig. 2. Logarithmically scaled Hα flux maps from MUSE observations overlaid with contours from the CO(1-0) integrated intensity maps for three new ALMA sources: Centaurus (left panel), RXCJ1539.5−8335 (middle panel), and Abell S1101 (right panel). The co-spatial and morphological correlation between the warm ionized and cold molecular nebulae is clear in these maps. The CO(1-0) emission has been continuum-subtracted and binned from −300 km s−1 to +300 km s−1. The ALMA beam is shown in the upper right corner of each panel. The CO(1-0) contours for Centaurus are: 3σ, 5σ, 7σ, for RXCJ1539.5−8335 are: 3σ, 10σ, 30σ, 50σ, 70σ, etc., and for Abell S1101 are: 3σ, 5σ, 7σ. In the panel showing the data for Centaurus, the small green circle indicates the location of the highest surface brightness Hα emission without any CO emission (see text for details). |
Centaurus. The continuum-subtracted CO(1-0) map distribution of Centaurus (Fig. 2) reveals a filamentary emission that spans over ∼5.6 kpc (28″) and that is co-spatial with almost all the brightest emission from the warm ionized nebula. However, the correspondence is not perfect. The brightest nuclear region in Centaurus (marked with a green circle in the Fig. 2) seen in the warm ionized gas shows no detection of molecular emission. This could be due to several factors: the molecular gas in the central regions could have been highly excited, and not particularly bright in the low J transitions of CO, or destroyed or expelled by the AGN, leaving no molecular gas to emit. It is possible that the molecular gas was consumed by star formation as a consequence of positive feedback. Without information about other transitions or evidence of recent star formation, we can only speculate.
RXCJ1539.5−8335. In RXCJ1539.5−8335 the CO(1-0) emission distribution appears to be complex and filamentary, spanning along 48.8 kpc (34″) and matching morphologically with the brightest warm ionized nebula from the Hα MUSE observations (see central panel of Fig. 2).
Abell S1101. The CO(1-0) integrated emission map of Abell S1101 (Fig. 2) shows a filament that extends up to 14.4 kpc (13″) in the south–north direction, which is also co-spatial with the strongest line-emitting regions of the warm ionized nebula.
4.3. Total mass and mass distribution of the molecular gas
We fitted each CO line with one or two Gaussian profiles extracted from a rectangular aperture encompassing all emission with a significance ≥3σ from the primary beam corrected data cube. Values of (i) the integrated emission, SCOΔν; (ii) the line FWHM; (iii) the velocity offset relative to the systemic velocity of the BCG, voffset; (iv) the peak emission flux density; (v) the CO(1-0) line luminosity, LCO; (vi) molecular masses, Mmol; and (vii) molecular surface densities, Σmol are all listed in Table 4. The values therein were compared with the SPECFLUX task in CASA, recovering similar values within about 10–30%. The molecular gas masses for the three ALMA sources, Centaurus, RXJ1539.5 and Abell S1101, were calculated from the integrated CO(1-0) intensity under the assumption of a Galactic CO-to-H2 conversion factor, XCO, as,
 (1)
(1)
Fit parameters of the CO emission lines for different regions.
where XCO = 2 × 1020 cm−2 (K km s−1)−1 as is found for the Milky Way disk (Solomon et al. 1987), DL is the luminosity distance, and z is the redshift of the BCG. The major uncertainty in the molecular mass comes from the conversion factor, XCO, because the Galactic conversion factor is not expected or observed to be universal (see, Bolatto et al. 2013; Vantyghem et al. 2018, for reviews). The value of the conversion factor depends on the metallicity and whether or not the CO emission is optically thick. Similar CO-to-H2 conversion factors have been used for the molecular mass calculation in previous studies (e.g., McNamara et al. 2014; Russell et al. 2014, 2017a; Tremblay et al. 2018). We compared the total fraction of molecular gas lying inside filaments, that is, the gas within coherent structures outside of the main nuclear peak of emission. The integrated CO(1-0) intensity values used are those listed in Table 4.
In Centaurus, the main central gas peak accounts for ∼50% of the total molecular mass and has a molecular mass of (4.9 ± 0.2) × 107 M⊙. The southern filaments 1 and 2 contain (3.0 ± 0.2) × 107 M⊙ and (1.5 ± 0.2) × 107 M⊙, respectively, resulting in a total molecular mass of ∼9.4 × 10⁷ M⊙. This is close to the molecular mass found by Fabian et al. (2016), ∼2.2 × 10⁸ M⊙, which was based on 3.4σ detection of CO(2-1) emission and by assuming a flux density CO(2-1)/CO(1-0) ratio of 3.2 (Braine & Combes 1992; see below).
In RXJ1539.5, the main central peak, with a total mass of (97.2 ± 3.7) × 108 M⊙, accounts for ∼75% of the total molecular mass. The western filament contains (8.6 ± 1.2) × 108 M⊙. The lump of the eastern filament contains (6.2 ± 1.3) × 108 M⊙, and the smaller filament to the N of the central components has a molecular mass of (2.5 ± 1.2) × 108 M⊙, resulting in a total detected molecular gas mass of ∼1.3 × 10¹⁰ M⊙.
For Abell S1101 the northern and southern clumps contain similar amounts of molecular gas. For the northern and southern clumps, we derived a molecular mass of (5.4 ± 1.4) × 108 M⊙ and (5.5 ± 1.4) × 108 M⊙, respectively. The mass of the eastern clump is 0.28 ± 0.06 × 10⁸ M⊙. Summing up all the mass estimates, the total detected molecular mass is ∼10.8 × 10⁸ M⊙ for this source.
We computed the molecular mass estimates and filamentary mass fractions in the same way for all sources studied, that is for the ones we observed and those from the archival data. We identified filaments in each of these sources. The molecular masses of each filament are listed in the Table 6. When necessary, we assumed a flux density line ratio CO(2-1)/CO(1-0) = 3.2 (Braine & Combes 1992) and CO(3-2)/CO(1-0) ∼ 0.8 (Edge 2001; Russell et al. 2016) in Eq. (1). The molecular masses of the filaments in the sample lie in the range of 3 × 10⁸ to 5 × 10¹⁰ M⊙, with a median value of ∼2 × 10⁹ M⊙. The filaments typically account for 20–50% of the total molecular mass and can be as high as 75–100% for those objects where the CO line emission is offset from the central BCG. We emphasize that the cold molecular gas masses are likely to be lower limits, since it is highly probable that the CO emission from the filaments is more extended and may follow the distribution of the optical filaments; high-sensitivity ALMA observations are needed to confirm this (see Sect. 5).
4.4. ALMA molecular filaments in a sample of 15 BCGs
Figure 3 displays the CO moment maps together with the X-ray and optical images from Chandra, HST, and MUSE observations. The moment maps of each object, that is, the integrated intensity, line-of-sight velocity, and velocity dispersion maps, were constructed using the masked moment technique (Dame 2011)1. This technique creates a Hanning smoothed three-dimensional mask that takes coherence into account in position–velocity space to exclude pixels that do not have significant signal but still capture weak emission that simply clipping by a constant value of σ might miss. Zero-, first-, and second-moment maps were created using this mask on the unsmoothed cube which recovers as much flux as possible while optimizing S/N and keeping only the regions where the CO lines were detected with a significance greater than 3σ. The detailed description of the cold molecular gas distribution for the core of each individual galaxy cluster can be found in Appendix B.1.
 |
Fig. 3. First panel of each row: Chandra X-ray image with VLA radio contours overlaid in red. Dashed white lines indicate previously identified X-ray cavity positions. Black contours represent the distribution of the cold molecular gas. Second panel of each row: optical image from HST overlaid with black contours representing the distribution of the cold molecular gas. We show Hα emission distribution as orange contours. The first two panels cover the same area. Panels 3−5 from the left along each row: the three panels are, in order from left to right, the first-, second-, and third-moment maps of the ≥3σ CO emission (i.e., intensity map, integrated intensity velocity map, and velocity dispersion map). All source names are indicated at the top right in the first panel of each row and the contents of each image is given in the upper right of each panel. In the moment-zero map, the red contours represent the radio emission from VLA observations from 1.58 GHz for Centaurus, 1.46 GHz for Abell S1101, 1.46 GHz for PKS 0745−191, 1.45 GHz for Abell 262 and 4.89 GHz for Hydra-A, 4.86 GHz for Abell 2597, 4.91 GHz for M 87, 4.19 GHz for Abell 1795, 4.89 GHz for 2A 0335+096, and 1.46 GHz for PKS 0745−191. The white cross indicates the position of the mm-continuum source. The velocity dispersion sometimes appears high because of the presence of multiple velocity components; each component has a small velocity dispersion. |
 |
Fig. 3. continued. |
 |
Fig. 3. continued. |
 |
Fig. 3. continued. |
As can be seen from Fig. 3, the CO morphology varies from system to system. We classify these gas distributions into two distinct categories based on the morphologies and kinematics of their molecular emission: (1) those with extended filamentary molecular gas emission and no-rotating kinematics; and (2) with nuclear molecular emission distribution only, dominated by rotation. The extended molecular sources have a ratio of the molecular radial extension to effective radius (Reff) of the BCG higher than 0.5, rmol/Reff ≥ 0.5, while the nuclear molecular sources, have a rmol/Reff ≤ 0.35. The classification and properties of each system are listed in Table 6.
Extended molecular gas emission: Category (1) Extended Sources. Thirteen of the 15 sources were found with complex and extended cold molecular filamentary morphologies (see Fig. 3). A position–velocity diagram was extracted from each data cube along coherent physical structures to measure the filament length using the Python package PV EXTRACTOR. The filaments extend over 2–25 kpc, with a mean length of ∼11–12 kpc and in general are located preferentially around the X-ray cavities seen with Chandra, or at radii less than the extended radio lobes. The cold molecular gas sometimes peaks in the nuclear region of the central galaxy, for example, Abell 2597 and RXJ1539.5. Some other extended systems show an offset between the CO peak position and the location of a BCG. In these sources, most of the cold gas lies outside the position of the BCG, for example, RXJ0820.9+0752 and M 87. Some others have two CO peaks, with the second CO peak outside the BCG which contains a majority of the gas (> 50%), for example, Abell 3581 and Abell 1795; and sometimes a similar fraction of the central CO peak, for example, Centaurus, Abell 3581 and Abell S1101.
One striking feature is that the filaments are very massive, (Mmol = few × 108–1010 M⊙) or 0.25−50 times the molecular gas mass of the Milky-Way. The filaments encompass at least 20–50% of the total molecular mass, or even 75–100% for those objects that are highly offset relative to the central BCG or lack a central emission component. The clumpy molecular filaments detected have a mean length of 11–12 kpc taking into account all the CO transitions and a width smaller than 0.5–3.5 kpc (the filaments are not resolved). The spatial resolution of the ALMA observations is insufficient to resolve the filamentary structures at 60 pc scales observed in Hα from high-resolution HST imaging of Centaurus (Fabian et al. 2016) or even the lower-resolution Hα data, 100−500 pc, of Perseus (Conselice et al. 2001).
For four objects of our sample the molecular gas is projected onto the nuclear region of the host galaxy, that is, Abell 1664, Abell 1835, and PKS 0745−191. However, the low spatial resolution of our data clearly prevents us from resolving more structures in those objects. Higher-angular-resolution interferometry of these objects would likely show the presence of filaments. PKS 0745−0191 is a clear example of an unresolved source in CO(1-0) that in fact hosts three clear filaments when observed in CO(3-2) with a smaller synthesized beam.
The low-redshift systems, those with z < 0.1, for example, Centaurus, Abell 3581, and Abell S1101, all have low SFR and AGN power, 1–37 M⊙ yr−1, Pcav < 1.6 × 1044 erg s−1 and cold molecular masses below ∼1010 M⊙. Objects which lie at higher redshifts, z > 0.1, generally have higher cold molecular masses, Mmol = 1–5 × 10¹⁰ M⊙, higher SFR, 13–600 M⊙ yr−1, and more powerful AGNs with Pcav ∼ 1–47 × 1044 erg s−1 (Table 6). This is a clear bias due to the small size of the current sample and the lack of sensitivity of the current observations necessary to detect more compact and less powerful clusters at large distances.
Nuclear molecular emission: The Category (2) Compact Sources. Two systems, Abell 262 (its BCG is NGC 708) and Hydra-A (Rose et al. 2019), show compact cold molecular kiloparsec-scale disks with isophotal sizes of ∼1.2 kpc and 2.4–5.2 kpc, respectively. The molecular gas masses in these disks are 3.4 × 10⁸ M⊙ and 5.4 × 10⁹ M⊙, which are three to ten times the mass of molecular gas in the filaments found in BCGs at roughly the same redshift. Both systems show a double peaked line profile, a clear gradient in their velocity maps. This is characteristic of rotating disks and they have maximum velocity differences across their line emission between 400 and 600 km s−1 (Fig. 3). We note that the rotation is in a plane perpendicular to the projected orientation of the radio jets from the VLA observations (Fig. 3).
4.5. Velocity structure of the molecular gas
Figure 3 shows the maps of the mean line-of-sight velocity (moment 1) and velocity dispersion of each system (moment 2). The detailed descriptions of the velocity structures for each object are found in Appendix B.2.
Slow and disturbed motions. There is a lack of relaxed structures such as rotating disks in the central core of the galaxy cluster apart from in two systems: Abell 262 and Hydra-A. The cold molecular gas in some of the galaxy cluster cores shows disturbed velocities, for example, RXJ1539, while others show smooth velocity gradients in substructures indicating inflow or outflow of gas. The possibility of superposition of several filaments in projection along the LOS makes the interpretation of velocity fields challenging. Generally, the cold molecular gas has complex velocity fields, with gas found at projected LOS velocities that span over 100–400 km s−1 (without taking into account the high-velocity components). These values are relatively large but still much lower than expected if the gas falls ballistically to the cluster center from a few to a few tens of kiloparsec, for example, ∼300 to ∼1000 km s−1. The velocity differences of several hundred kilometers per second are likely due to the presence of distinct velocity components and presumably different physical structures. Indeed, velocity gradients inside coherent substructures are rather small (∼20 km s−1 kpc−1 (Table 7)).
High-velocity components. In a few objects (3 out of 15) we detected high-velocity components (which we term high-velocity systems (HVSs)): in both Abell 1664 (Russell et al. 2014) and Abell 3581 these are at −570 km s−1 relative to the systemic velocity, and in Phoenix-A one is found at +600 km s−1. In Abell 1664, the velocity of the cold gas in the HVS increases towards the center of the BCG and may be a flow close to the nucleus (inflow or outflow; Russell et al. 2016). While more interestingly the velocity of the HVS in Abell 3581 increases from west to east at a PA ∼ −50° relative to the filament along the south to north direction where a young star cluster has been detected (Canning et al. 2013). This star cluster could be accelerating the cold gas (inflowing or outflowing) in the opposite projected direction to the radio bubbles from the AGN.
The HVSs have a vmax/σ* ≥ 2–3, where vmax is the maximum CO velocity and σ* is the stellar velocity dispersion of the galaxy (see Table 5). The no-HVS correspond to vmax/σ* ∼ 0.5–1.5. The location of these high-velocity components is ∼1.5–5.5 kpc from the nucleus of the BCG, namely, RHVS/Reff < 1, which suggests that the dynamics of these HVSs are linked to the host galaxy, that is, an inflow or outflow of cold molecular gas. The mechanical power of the jet is the most powerful source in those systems. Although the jet momentum seems to be insufficient to lift the molecular gas, simulations suggest that the strong molecular outflows result from particularly strong updrafts that stimulate condensation of hot gas into dense molecular clouds along the wake of the bubbles. However, we cannot rule out the possibility that HVSs are the result of SN feedback (possibly Abell 3581) or an interaction with some nearby galaxy or AGN winds.
Estimates of various timescales and their ratios.
Source properties.
Properties of the cold molecular filaments.
Velocity dispersion. The velocity dispersion maps of most objects in the sample show a profile which peaks towards the center of the system, σ = 100–150 km s−1, and falls well below 50 km s−1 at larger radii where the intensity of the molecular gas declines. This is not surprising given that in the central region, the AGN jets and the BCG bulk motions may be able to inject more kinetic energy globally, disturbing the cold molecular gas. Interestingly some systems show additional peaks away from the central galaxy where the gas is more kinematically disturbed, creating regions of high velocity dispersion; for example Abell 1795 (SN curved filament), 2A 0335+096 (NE filament), and Centaurus (Plume filament), among others. In some objects in Fig. 3 the velocity dispersion may appear high only because there exist multiple velocity components. Furthermore, the velocity dispersions of molecular gas generally tend to be well below the velocity dispersions of the stars, where σ* for a BCG is typically ∼300 km s−1 (Von Der Linden et al. 2007) and up to 480 km s−1 in our sample.
5. Discussion
5.1. General properties of the cold molecular gas
From the sample studied with ALMA we identify two distinct distribution categories. The nuclear molecular emission systems (Category compact) described earlier account for the smallest fraction of objects, that is 2 out of 15, while the filamentary distribution (Category extended) accounts for the remaining 13 objects. Category extended systems generally show unrelaxed-state structures with disturbed motions along the filaments. On the other hand, the two Category compact systems are well described by relaxed structures showing ordered motions within a compact (∼2–5 kpc length) and thin (∼kpc) rotating disk located at the very center of the BCG. This cold gas disk may be an important step in driving the gas into the vicinity of the AGN. In an AGN-regulated scenario, one indeed expects a fraction of the cooled gas to eventually fuel the SMBH to maintain the powerful jets which are injecting mechanical energy into the ICM. We note that both systems show multiphase structures and have similar SFRs, ∼0.8 M⊙ yr−1. Simulations found a stable rotating disk (or torus) at the center of the galaxy clusters (Gaspari et al. 2012, 2018; Li et al. 2015; Prasad et al. 2018, 2015), as a result of a large burst of cold gas formation.
For the systems in Category extended, the molecular distribution usually consists of a nuclear emission component closely related to the core of the BCG, and a set of extended massive clumpy filaments, with cold molecular masses of a few × 108–1010 M⊙. Something must explain that large amounts of cold gas (often the dominant part) are found offset from the BCG position. Motions induced via BCG in the cluster potential wells (cooling-wake) or AGN-driven motions may contribute to displace the cooling gas away from the core of the central galaxy.
What is slowing down the cold molecular gas? As mentioned earlier, on average, the velocities of the cold clouds are slow through the molecular gas, lying in a range of 100–400 km s−1. Those molecular velocities are inconsistent with the scenario of simple freely in-falling gas, where higher velocities are expected, around ∼300–1000 km s−1. As infalling material is likely dynamically coupled to feedback outflows and subject to ram pressure, the gas infall time, tI, is generally larger than the free fall time, tff (McNamara et al. 2016). The infall time could be easily two to three times longer than tff, meaning that the gas in its slow fall has time to entrain and cool more warm gas, and the corresponding ratio tcool/tI might be more representative than tcool/tff of the physics involved.
The ram pressure is likely to have a significant influence, and we can compute an order of magnitude of the terminal velocity Vt acquired by a molecular cloud of size dcl and density ρcl falling in the ICM of density ρICM, at a distance R from the center of the cluster/BCG. The ram-pressure force exerted on the cloud of surface S is ρICM S  , and by definition of the terminal velocity should be equal to the gravitational force exerted on the cloud of mass mcl ∼ ρcldcl S. The latter is equal to gmcl, and g =
  , where Vr is the circular velocity of the potential of the BCG at that radius R. Equating the two forces yields the equation
 (2)
(2)
For a typical giant molecular cloud (GMC), or giant molecular association (GMA) where N(H2) ∼ 1021 cm−2, with a density ρICM ∼ 0.1 cm−3 at R = 10 kpc (e.g., Hogan et al. 2017), the right hand side is equal to unity, meaning that the terminal velocity is comparable to the equivalent rotational velocity in the potential of the BCG at 10 kpc, that is, ∼300 km s−1. This means that the order of magnitude of the observed velocities appears perfectly compatible with a scenario where clouds reach the terminal velocity, and are almost floating freely (without acceleration) in the ICM medium, slowly infalling onto the center of the BCG, and fueling the central AGN. Indeed this is true on average, with a lot of factors that can be varied both on the density of the ICM and column densities of the effective clouds, since there is a size and mass spectrum of molecular clouds (albeit with an average column density that varies slowly with size; Solomon et al. 1987; Elmegreen & Falgarone 1996). Numerical simulations of a multiphase gas have shown that the physical state and fragmentation structure of the molecular clouds might be quite different in the environment of the hot atmosphere (Sparre et al. 2018): the clouds could be surrounded by a co-moving gas layer protecting them from destruction, and they could shield themselves by behaving like a single stream (Forbes & Lin 2018).
The AGN may create an active wind, able to provide an additional ram-pressure against the in-falling molecular clouds in the cluster center (r < 10 kpc). The efficiency of ram-pressure in slowing down the molecular velocities at small radii requires that the molecular filaments be “thready”, that is, that the cold filaments are moving within a skin of warmer gas (Li et al. 2018; Jaffe et al. 2005). The magnetic field of the ICM can also increase the drag force on the cold clouds decreasing their velocity (McCourt et al. 2015). Chaotic motions driven by turbulence may also cancel some of the extreme velocities, and the superposition of inflowing and outflowing filaments along the line of sight can mix and cancel velocities structures.
5.2. Evidence for cold and ionized emission arising from the same ensemble of clouds.
Figure 4 shows the relative characteristics of the Hα and CO in three different ways: (i) normalized flux ratio (normalized by each emission peak); (ii) line-of-sight velocity difference; and (iii) velocity dispersion ratio for the sources for which both ALMA and MUSE observations are available (Table 1).
 |
Fig. 4. Maps of the ratio between the Hα and CO linear normalized flux ratio, line-of-sight velocity difference and velocity dispersion ratio for Centaurus, RXJ1539.5, Abell S1101, Abell 2597, Abell 3581, PKS 0745−191, Abell 1795, RXJ0820.9+0752, 2A0335+096, and Hydra-A from ALMA and MUSE observations. Those maps were made by dividing the corresponding MUSE and ALMA moment maps, respectively. We smoothed the datacube to account for different spatial resolutions (see text for details). Furthermore, the velocity dispersion ratio map shows that, on average, the Hα velocity dispersion is broader than that for CO by a factor of two to three. |
 |
Fig. 4. continued. |
The MUSE maps were smoothed to match the resolution of the ALMA data for each object and, using the REPROJECT task from the ASTROPY package, we resampled the ALMA data onto the MUSE data pixel grids. We made a small WCS shift in the ALMA maps of below (x, y) = ( ± 8, ± 8) pixels (or ∼1″) to match the MUSE intensity image, assuming that the CO and Hα are aligned morphologically. Depending on science application, the re-projected ALMA image was then either divided directly by the MUSE map, or divided after normalization (e.g., the normalized flux) or rescaling by some other factor (e.g., to convert pixel units). In the cases of PKS 0745−191, RXJ0820.9+0752, and 2A 0335+096, two molecular emission lines are available : CO(1-0) and CO(3-2). In order to compare with MUSE at larger scales, we choose the CO(1-0) emission line as the most reliable tracer of the molecular gas.
Molecular and ionized nebula are co-spatial and co-moving. The molecular gas is generally spatially distributed along the brightest emission from the warm ionized nebula (Sect. 4.2). It also appears that the cold molecular and warm ionized gas also share the same overall velocity structure (Fig. 4). The velocity difference maps are, in general, filled with velocity offsets well below 100 km s−1, which indicate that the Hα and CO emission regions are likely co-moving. Indeed, a difference of 100 km s−1 may be explained by the different Halpha and ALMA spatial resolutions (ALMA beam can go from 0.3 to 3 arcsec, that is, from 0.3 to 4 kpc), and the V-gradient averaged out in a beam can already account for 50−100 km s−1. The moment-two CO maps show maxima at ∼100 km s−1.
Molecular clouds have lower-velocity dispersions than the ionized nebula. The comparison between Hα and CO(1-0) emissions indicates that the Hα velocity dispersion is broader than the CO one by a factor of about two (Fig. 4). Tremblay et al. (2018) suggested that lines of sight are likely to intersect more warm gas than cold clouds, which would lead to a broader velocity distribution in the warm ionized gas than in the cold molecular gas. Gaspari et al. (2018) have shown that warm gas is more likely to be turbulent with higher velocities compared to the cold molecular gas. This is compatible with the millimeter and the optical emissions arising from the same structures: the filaments around BCGs are made of a large number of dense molecular clumps (and clouds). The cloud surfaces are then heated and excited by various mechanisms (intracluster UV radiation field, X-rays, and ionizing photons from the AGN, X-ray emission from the ICM, etc.) and are bright in optical emission lines. In the following, we argue that the excitation is due to processes that are local to the environment of the filament.
The ratio of the Hα and CO fluxes is constant along the nebula. The normalized Hα-to-CO flux ratios are close to unity all along the nebula (Fig. 4). There is not a large radial variation of this ratio for all the BCGs studied, apart from for a few systems like Abell 1795, Abell 2597, and Abell 3581 (Fig. A.1). The lack of significant radial gradients in the flux ratios indicates a local excitation mechanism (Lim et al. 2012).
In a few rare cases, some variations are seen in the Hα-to-CO flux ratios, and in a few cases the peak of the CO is not located at the same position as the peak in Hα, which is offset from the BCG center, having a high Hα-to-CO flux ratio of approximately two or three at this position. Otherwise, we observe a lack of Hα emission in regions of bright CO emission. Recent star formation can consume the molecular gas and also increase the surface brightness of Hα thereby increasing the Hα-to-CO flux ratio. Other mechanisms, such as photo-dissociation or evaporation by collisions with hot electrons, could reduce the amount of molecular gas available. Dust attenuation of the optical emission lines can reduce the Hα flux, decreasing the Hα-to-CO flux ratio.
Could the molecular component be as extended as the ionized filaments? It is possible that the molecular filaments are as long as those seen in Hα, as previously observed in Perseus (Salomé et al. 2006, 2011). ALMA observations detect about 50–80% of the emission measured by single-dish observations with the IRAM 30 m telescope (Edge 2001; Salomé & Combes 2003; Pulido et al. 2018) and it is clear that the ALMA observations may be missing molecular gas.
Based on the un-normalized flux maps of the MUSE and ALMA observations, we derived the total expected molecular mass by assuming that: (i) molecular emission should be detected over all ionized nebula, and that (ii) the flux ratio of the molecular and ionized gas is constant for all radii. We note that the second statement is not true for all sources, where the un-normalized flux ratio decreases at larger radii in some objects; see Fig. A.1. In order to compute the expected total molecular mass, we therefore used the most common value of the Hα-to-CO flux ratios.
We then find that the expected total molecular mass is a factor of approximately 1.2 to 6 times higher than the one derived from ALMA observations, with a median of 2.5; see Fig. 5. This means that the total amount of gas cycling around the BCGs could be of the order of 109–1011 M⊙. Future high-sensitivity ALMA observations are needed to confirm this in order to detect even the faintest filamentary emission.
 |
Fig. 5. Molecular mass ratio from IRAM observations (blue leftward-pointing triangles) and those based on extrapolation of the CO measurements assuming a constant Hα-to-CO flux ratio (red stars; see text for details) over total molecular masses from ALMA. The IRAM measurements are taken from Edge (2001), Salomé & Combes (2003) and Pulido et al. (2018). The measured and expected mass of the molecular gas in RXJ0821+0752 is almost the same. Indeed the ratio of expected to measured molecular mass from ALMA and IRAM is close to unity, between 1.2 and 1.4, suggesting that ALMA has detected a significant fraction of the molecular mass. These mass comparisons are all based on the same fluxes, and therefore are not affected by the CO-to-H2 conversion factor. |
Such correlations can also be interpreted as the manifestation of a common origin, like the condensation of low-entropy gas via the top-down multiphase condensation cascade through thermal instabilities. The conversion of the hot gas into a multiphase medium regulated by the formation of thermal instabilities has been discussed frequently in the last few years.
5.3. Origin of the cooling gas
Cooling from the hot ICM atmosphere can naturally explain the spatial correlation of the different temperature phases of the gas, owing to an extremely short cooling phase time: only a few tens of millions of years for low-density (10−2 cm−3), intermediate-temperature (106 K) gas with a cooling rate of Ṁcool = 1–10 M⊙ yr−1.
The thermal plasma of the ICM gas appears to be much more complex and out of equilibrium than the first cooling flow models (Fabian 2012), and the observed turbulence, bubbles, and shocks are the likely manifestation of a self-regulation between radiative cooling and AGN heating. Their blurring of the picture prevents a clear grasp of what is really going on, and numerical simulations have provided very helpful insight into the phenomena. Pizzolato & Soker (2006) have already established through equations that the bubbles are subject to Rayleigh-Taylor and Kelvin-Helmoltz instabilities. Revaz et al. (2008) simulated an AGN-driven hot plasma bubble rising buoyantly in the intra-cluster thermal medium. These latter authors have shown that the bubble was efficiently lifting some low-entropy gas present at the center of clusters to a higher radius where the cooling conditions were more favorable. The gas then cooled radiatively in a few tens of millions of years and became neutral. Losing its thermal support, it then started to inflow in cold filamentary structures around and below the bubbles. The magnetic field in the filaments could contribute to the pressure or a few order of the thermal pressure, and it could approach equipartition around the filaments, which could also help to stabilize the filaments against collapse and star formation (Fabian et al. 2016). Thermal and magnetothermal instabilities have been studied in detailed simulations of the intra-cluster plasma by McCourt et al. (2012) and Sharma et al. (2012) showing that local instabilities could trigger the formation of a multi-phase medium in which density contrast could then cause cold filaments to condense out of the hot medium. For this cooling to occur, it is sufficient that the thermal instability timescale tTI falls below ten times the free-fall time, or tTI/tff ∼ 10.
The role of AGN feedback on the turbulent and chaotic behavior of the intra-cluster plasma was emphasized by Gaspari et al. (2011, 2012). These latter authors showed how the AGN jets and bubbles create the turbulence and the instabilities (though large-scale cosmological infall can also produce such turbulence in the ICM (Dubois et al. 2011), accompanied by density contrast and radiative cooling, causing the gas to condense. The chaotic cold accretion (CCA) is then the consequence of the self-regulation of the cooling and heating by the AGN.
Voit et al. (2015) also noticed that cold gas condenses in the center of clusters when a threshold for instability is reached, and propose a precipitation model. These latter authors note that the ratio tcool/tff remains constant in a central floor when the entropy profile is K ∝ r2/3, as observed by Panagoulia et al. (2013), and that the potential due essentially to the BCG stellar component is isothermal (Hogan et al. 2017). This floor might be due to self-regulation by turbulent driving of gravity wave oscillations (Voit 2018).
McNamara et al. (2016) promote a stimulated feedback mechanism. They use an infall time-scale tI, which is longer than the free-fall time by a factor of a few. Together with the classical thermal instability theory, they propose that it is the uplifted low-entropy gas trapped with the rising bubble that can eventually cool and condense in cold filaments. The significance of uplift is now an integral aspect of the precipitation model (Voit et al. 2017) as well as of the Chaotic cold Accretion model (Gaspari et al. 2018).
5.3.1. Are molecular gas clumps formed in low-entropy gas dragged-up by radio lobes?
Molecular filaments are often trailing the X-ray cavities or aligned in the direction of the radio jets. The drag of molecular gas by the radio jet is not expected to be very significant on large spatial scales, principally because it requires moving small, very dense clumps. Models indicate that the acceleration timescales of the dense clumps are generally longer than the dynamical timescale of the system (Wagner et al. 2012; Li & Bryan 2012, 2014; Gaibler 2014). A preferred scenario is cold gas (re-)formation from a hotter but lower-entropy gas within the inner radii of the ICM that is lifted by the AGN jets and bubbles (Revaz et al. 2008). X-ray cavities are often found to be surrounded (in projection) by cold and dense molecular filaments. The cold gas and radio jets and lobes would have to be strongly coupled to displace the large molecular masses found in those systems (Russell et al. 2017b). Hot diffuse gas that fills the ICM is much easier to lift and may cool via thermal instabilities to form cold clouds (Li & Bryan 2014). Eventually the cold gas will decouple from the hot gas and the expanding cavities and will fall back towards the center of the potential and the AGN.
In Centaurus, the molecular filaments are draped around the exterior of the radio bubble. The southern filament shows a shallow velocity gradient over 100 km s−1 and is not purely radial. The last middle section of the filament is situated in projection along the edge of the eastern radio lobe. The nonradial directionality of the filament may arise because the inner portion of the filament is located behind the X-ray cavity dragged by the radio lobes. Therefore, both features, that is, bulk motions along the filament plus those closely associated with the radio lobes, indicate that the filaments are flowing, being either gas entrained by the expanding radio bubbles or gas falling back onto the central BCG. In RXJ1539.5 there is no obvious connection between any cavity and cold filaments, even though there is a good overall morphological correlation between the X-ray and cold or warm filaments, which might suggest a different mechanism for the formation of the cold gas in this system. In addition, some filaments detected in CO and Hα do not show any close connection with X-ray cavities: the northern network of filaments in Abell S1101 is a good example of this phenomenon.
Several ALMA data sets have shown that X-ray cavities are capable of lifting enough low entropy gas to form their trailing molecular filaments (e.g. McNamara et al. 2014; Russell et al. 2016, 2017a,b; Vantyghem et al. 2016, 2018; Tremblay et al. 2018). However, in RXJ0820.9+0752, the power of the X-ray cavity is too feeble to account for the current gas distribution suggesting perhaps that the association between X-ray cavities and molecular gas is not always water tight. It is also likely that the condensation of the hot atmosphere has been triggered by sloshing motions induced by the interaction with a nearby galaxy group, rather than by uplifting low-entropy gas (Bayer-Kim et al. 2002; Vantyghem et al. 2019). We note that older X-ray cavities could be decoupled from filaments, while young cavities could be associated with warm or cold filaments along their wakes and/or rims (e.g., Tremblay et al. 2018). Projection effects and geometry uncertainties make the lack of association between the filaments and cavities a weak argument to rule out the uplifting scenario. One solution to tackle this issue is to try to evaluate the age of the cavities. Different methods have been discussed in the literature (see, Bîrzan et al. 2004) to compute tage, assumed to be either their buoyancy rise time R/vt (where R is the distance of the cavity from the center and vt is the terminal velocity) or the sound crossing times R/cs (cs being the sound speed). A dedicated analysis of deep X-ray and optical observations is required to probe this scenario in more detail.
We estimated that 10–50% of the low-entropy gas displaced by the radio bubbles in Centaurus and Abell S1101 could end up in the form of molecular clouds. Simple energetic arguments suggest that radio bubbles are powerful enough in the two new ALMA sources (Centaurus and Abell S1101) to lift the low-entropy gas in order to form the cold molecular clouds along the cavity. In RXJ1539.5, no clear X-ray cavities have been found to date.
In Centaurus, the hot gas displaced (Mdisp = μ(mp + me)neV) by the two cavities associated with the molecular component during their inflation is at least ∼6 × 10⁸ M⊙ (using the X-ray gas density and cavity sizes from Rafferty et al. 2006). The molecular gas in the filaments has a lower mass, 0.45 × 10⁸ M⊙, than the low-entropy gas displaced by the cavities. The cavity has an estimated 4PV work, Ecav ∼ 1.0 × 1057 erg, and the total kinetic energy in the cold molecular gas,  , is a few of orders of magnitude lower, ∼5.4 × 1054 erg. From this order-of-magnitude estimate, it is energetically possible for the cavity to have lifted and displaced sufficient low-entropy gas to form the cold filaments.
The filament in Abell S1101 appears associated with the X-ray cavities located SE of the BCG nucleus. The work, 4PV, done by the expansion of the radio bubbles in the hot atmosphere is ∼7 × 1058 erg (Werner et al. 2011). The mass of the hot gas displaced is around ∼2 × 10⁹ M⊙, while the molecular mass of the filament is less than this, about 1.0 × 10⁹ M⊙. The kinetic energy of the filament, which is moving with a velocity of 170 km s−1, is ≈3 × 1056 erg. Therefore it is energetically feasible to lift and displace enough low-entropy gas to explain the entire mass of the molecular emission line gas. We note that a difference in mass ratio (of ∼10), X-ray displaces mass over molecular mass, is found given the similar energy budget of the two sources (Ecav/Ekin ∼ 200). However, this large spread in mass ratio is expected given all the uncertainties.
In order to investigate the efficiency of the cold gas condensation from the hot gas, we derived (i) the hot gas mass Mhot enclosed within the volume where the cold gas is found (at a radius of 2.5–27 kpc), and (ii) the classical mass deposition rate:  , with Mhot being the hot mass and tcool the cooling time measured at the projected length of the cold filaments.
In Fig. 6 (left panel), we show the ratio of the total molecular gas mass to the ICM hot gas mass, observed within the volume where the cold filaments are detected.
 |
Fig. 6. Left panel: ratio of hot mass (measured at the radius of the cold filaments) to total molecular mass. The equal ratio is indicated by a dashed line. The lengths of the cold filaments, rcold, are given in the bottom left-hand corner in kiloparsecs. Right panel: mass deposition rate (measured at rcold) against total molecular mass. The time required for the X-ray cooling to fuel the observed molecular gas mass is indicated by the dashed lines for guidelines at 108 yr and 109 yr. The cooling times measured at rcold are indicated in the top left-hand corner. |
We find that the hot gas mass is about 1.0–15 times higher than the total cold molecular mass; see Fig. 6 (left panel). This implies a hot-to-cold accumulated mass conversion of Mcold/Mhot ∼ 0.05–0.9. The mass in Hydra-A is dominated by the cold component. This suggests that the cold reservoir has been accumulated over several cooling cycles.
The deposition rate increases with radius r (see Fig. 7) and in general reaches a plateau when the cooling of the hot gas is no longer efficient at those larger distances. The projected length of the optical filaments generally falls close to the plateau. We checked that our deposition mass rate estimates, at the radius when the cooling time is 3 Gyr, are consistent with those measured by McDonald et al. (2018). We then compared the total molecular gas mass with the classical deposition rate. The molecular gas reservoirs accumulated on timescales of a few times 108 yr with some outliers at a few 107 and a few 109.
 |
Fig. 7. Deposition rate as a function of radius. The radial extent of the filaments is indicated with crosses and color-coded for each source. The deposition rate profiles are steeply increasing with the radii up to roughly the length of the warm filaments. |
5.3.2. Where does the gas cool?
We investigated where and how the cold gas condensed in the form of filaments by comparing the radial projected length of the filaments, measured from the nucleus of the BCGs to the farthest extension of the filaments seen in the warm ionized gas, with a variety of potentially important timescales and ICM properties: namely the entropy profiles K, the ratio of the cooling time and free-fall time, tcool/tff, and the eddy turn-over time, tcool/teddy. The ICM deprojected radial profiles, entropy, and derived cooling times for 13 sources of the current sample were taken from ACCEPT catalog (Archive of Chandra Cluster Entropy Profile Tables)2. We note that the accuracy in central thermodynamical properties of the X-ray emitting gas is limited by the resolution given by the spatial bin used in the analysis of the Chandra observations, which is determined by the S/N required to perform spectral analysis. We therefore excluded the central bin in the present study (see Fig. A.3).
The entropy profiles were calculated using the relation,  , where ne and TX are the electron density and the temperature of the X-ray emitting gas, respectively. The inner entropy profiles were fitted with two forms. The inner part of the profiles were fitted with a power-law, K ∝ rα, with α varying between 0.65 and 0.9 (K ∝ r2/3Panagoulia et al. 2013; Babyk et al. 2018) in the inner region (Voit et al. 2015, 2017; Babyk et al. 2018; Werner et al. 2019). For the outer zone, the profiles were fitted with a standard cluster entropy profile scaling as K ∝ rβ, with β ranging 1.1–1.2 (Voit et al. 2015; Babyk et al. 2018).
We also compare the deprojected cooling time, tcool, with the free-fall time, tff. The cooling and free-fall times were then computed as follows:
 (3)
(3)
where n is the total number density (2.3nH for a fully ionized plasma), and ne and nH are the electron and proton densities, respectively. Λ(T, Z) is the cooling function for a given temperature, T, and metal abundance, Z. The values of the cooling function were calculated using the flux of the best-fit spectral model (see Cavagnolo et al. 2009 for more details):
 (4)
(4)
where g is the acceleration due to gravity derived from the total mass of the cluster. The mass profiles contain two components: a Navarro-Frenk-White (NFW) component,  , to account for the majority of the cluster mass on large scales, and an isothermal sphere to account for the stellar mass of the BCG or
  , where the σ* corresponds to stellar velocity dispersion. The ρ0 and rs parameters were derived by fitting a NFW profile to the mass, derived through the X-ray emission profiles and by assuming hydrostatic equilibrium. The NFW parameters are similar to those found by Hogan et al. (2017) and Pulido et al. (2018) and are listed in the Table 5.
In Fig. 8, we show the cooling time versus the mean radius of each annulus, Rmid = (Rin + Rout)/2, where Rin and Rout are the inner and outer radius of the each annulus used to generate each spectrum in the Chandra data from the ACCEPT catalog. The plot shows a clear trend: lower radii (i.e., within ∼20 kpc) correspond to lower cooling times; cooling time decreases with radius (< 1 Gyr; see also McNamara et al. 2016; Hogan et al. 2017; Pulido et al. 2018).
 |
Fig. 8. Left panel: deprojected cooling time profiles, tcool. The dotted black horizontal lines in the left panel indicate a constant cooling time of 5 × 10⁹ yr, the observation-based upper-limit for the onset of nebular emission or/and recent star formation (Cavagnolo et al. 2008; Rafferty et al. 2008). The color of each line corresponds to a specific source as given in the legend in the upper left corner. The radial extent of the filaments is indicated with crosses and color-coded for each source. Right panel: free-fall time vs. radius for the different sources of our sample. As shown by McNamara et al. (2016), Hogan et al. (2017) and Pulido et al. (2018), the free-fall time profiles in the central region of interest lie on top of each other while the cooling times do not, leading to the conclusion that the driving parameter in the tcool/tff ratio is the cooling time. |
The radial deprojected entropy profiles show that the filaments are located (in projection) inside the region with low entropy and short cooling time (Fig. A.3). On the other hand, we find objects with cold filaments when the ratio of cooling time to free-fall time is tcool/tff ≲ 20 (Table 5). We also find that in 9 out of 13 clusters, the observed projected radial sizes of the Hα filaments (marked with crosses) often lie at the minimum value of the ratio, tcool/tff (Fig. 9).
 |
Fig. 9. Left panel: ratio of the cooling time to free-fall time, tcool/tff, as a function of radius. The corresponding source for each line is colored according to the legend in the upper left of the panel. We highlighted tcool/tff = 10 and 20 with a horizontal dashed line, which appears to be the approximate threshold for the onset of thermal instabilities (e.g., Li et al. 2015). Right panel: ratio of the cooling time to the eddy time as a function of radius. We highlight the C = tcool/teddy = σv/vcool = 1 with a horizontal dashed line, which shows the extent of the condensation region and can then be used to assess the multiphase nature of the gas in the BCG systems. We indicated the maximum radial extent of the filaments with colored crosses for each source (see legend in the upper-left corner). |
The sources Abell 1664, Abell 1795, and RXJ1539.5 exhibit filamentary structures of warm gas, but all have tcool/tff ≳ 20 and projected radial sizes that are located well beyond their min(tcool/tff). These exceptions could be a manifestation of sloshing motions which can affect the cooling time at larger radii (cold front, shocked regions), and also our estimation of tff. X-ray Chandra observations have shown that in Abell 1664 (Calzadilla et al. 2019) and Abell 1795 (Ehlert et al. 2015) the hot gas is sloshing in the gravitational potential, creating long (∼50–60 kpc) wakes of dense cooling hot gas. We also emphasize that any sloshing motions affect the distribution of mass, which could then have an impact on the free-fall time estimates.
The filament extents seem to lie at the minimum of the tcool/tff, in the central region where it is expected to remain flat (Hogan et al. 2017). Those ratios are in general above the canonical value of ten quoted in CCA and precipitation models. We note however that recent work discusses that the cooling can ensue when tcool/tff is up to 20: Voit (2018) describes that as soon as the ratio enters into the 10−20 zone, there is some thermal instability, also fostered by turbulence (i.e., triggered by the AGN bubbles) which introduces cooling, but also heating that prevents the ratio from falling below a lower value.
The role of bubbles.Gaspari et al. (2018) showed that the ratio between the gas cooling time and the turbulent eddy turnover time, C ≡ tcool/teddy, is useful for separating when the hot phase may transition from monophase to multiphase, thus providing some insight as to the physical nature of the hot ICM. The eddy turnover timescale, teddy, is the time at which a turbulent vortex is required to gyrate, producing density fluctuations in the hot atmosphere. The eddy turnover time is calculated as
 (5)
(5)
where σv is the velocity dispersion at the injection scale L. This criterium is based on the fact that the kinematics of the warm ionized gas correlate linearly with those of the hot turbulent medium. This was recently probed in Perseus by comparing the Hα+[NII] line width with the FeXXV-XXVI line widths determined in Hitomi Collaboration (2016). The injection scale, L, can be estimated using the diameter of the bubble inflated by the jet, which deposits the kinetic energy that is producing the turbulence (see Gaspari et al. 2018). Therefore, we only include sources that have measurements of their cavity properties (Table 5). The values used for the calculation of eddy turnover timescales, namely the injection scale and velocity dispersion, are given in Table 5. Given the weak dependence on the injection scale (L1/3), the value of the eddy timescale is mostly dependent on the values of σv. We note that teddy estimates have significant uncertainties due to difficulties in measuring bubble sizes in X-ray images, the limit in S/N of Chandra observations, and the large range of cavity and sizes in any given source.
The ratios of the cooling time to the eddy turn-over timescale, tcool/teddy, are close to unity, lying in the range 0.6–1.7 (Fig. 9), which is consistent with the range found by Gaspari et al. (2018, C = 0.6–1.8), and suggest a possible role of the bubbles in powering the cooling instability.
6. Summary and conclusions
We used high-resolution ALMA and MUSE observations to study the cold molecular and warm ionized gas in three cool core clusters – Centaurus, Abell S1101, and RXJ1539.5 – for which such data were not previously available. We then extended this investigation to include a total sample of 15 BCGs with similar available data with the goal of studying the origin of filamentary structures of warm ionized and cold molecular gas in cool core clusters. Characterizing the properties of these filaments is an important step to develop a complete census and to understand galaxy evolution and in particular gauge the importance of AGN feedback in clusters. Our conclusions can be summarized as follows:
(i) As already shown in other studies of individual objects, we find that most of the BCGs have unrelaxed filamentary structures with complex kinematics (13 sources out of 15), while only 2 objects have morphologies and kinematics consistent with a relaxed, central, rotating disk-like gas structure. These disk-like systems thus seem to be a temporary or rare stage in the life cycle of the cool gas. Generally speaking, 13 out of 15 clusters exhibit long, massive (108–1010 M⊙), cold, clumpy molecular filaments, with low velocity dispersions. These extended filaments comprise 20–50% of the total molecular mass, or even 75–100% for those objects that are offset relative to the central BCG with lack a central component. When cavities are present, they usually lie at radii greater than that of the filaments.
(ii) For all sources, the optical emission-line and molecular millimeter emission nebula correlate both spatially and kinematically. We conclude that the warm ionized gas and molecular gas are coming from the same structures: most of the mass lies in molecular kiloparsec-size filaments whose surface is warmer and emits optical emission lines. In most cases, the ratio of Hα to CO is constant along the filament. This suggests that a local mechanism must be responsible for the excitation of the gas (energetic particles, local radiation field, and/or shocks) as the distance to the central AGN does not play any significant role. Moreover, we suspect that the molecular emission in the outermost parts of the filaments is likely too faint and/or too diffuse to be detected in the current ALMA data sets. Assuming that the cold molecular filaments follow the whole ionized warm nebula with a constant CO/Hα ratio, we have used the Hα maps to derive an expected total molecular mass. We conclude that within this hypothesis, the total cold gas in cool-core filaments could be as much as ∼1.2–7 times larger than the molecular mass derived directly from ALMA data. More sensitive ALMA observations should be able to confirm this prediction.
(iii) We compared the projected total extent of the filaments in Hα to other characteristic radii for clusters. Using the ACCEPT sample X-ray ICM properties, we found that filaments always lie within the low-entropy and short cooling-time gas. The change in the slope of the entropy K ∝ r1.1 towards K ∝ r2/3 marks the boundary where filaments can start to form. The filaments nevertheless have a range of sizes inside this region. As described in the Chaotic Cold Accretion (Gaspari & Churazov 2013) or precipitation models (Voit et al. 2017), an important radius is when the cooling time exceeds the free-fall time by no more than a factor of ten. We find that in 9 out of 13 clusters the extent of the filaments roughly corresponds to the radius where tcool/tff is close to its minimum which is almost always between 10 and 20. We also compared the ratio tcool/teddy as a function of the extent of the filaments, where the eddy turnover time is related to the turbulence injection scale and is directly proportional to the diameter of the radio bubble. We find that for 8 out of 10 BCGs, the filaments lie in regions where this ratio is less than approximately one. In general the teddy seems to be ten times higher than tff. Therefore, the AGN bubbles may be powering the turbulent energy which triggers gas cooling by compression and thermal instabilities. In addition, we showed that the energy contained in the AGN cavities is enough to drag up some low-entropy (short tcool) gas in a region far from the center. Assuming that the gas can keep its original tcool, the tcool/tff would be low enough and consistent with an efficient cooling and condensation. The radio-AGN therefore prevents an overcooling on large scales, but is also the engine that triggers cold accretion along filamentary structures and provides the material to feed the regulated feedback cycle. The full condensation process includes bubbles inflation, uplift, and cocoon shocks, with turbulence being generated as a result. One or several mechanisms may therefore dominate, namely precipitation (or CCA), stimulated feedback, or even sloshing (driver of turbulence) in, for example, Abell 1795 and Abell 1664. In our sample, all of these processes seem to be responsible (to some degree) for the condensation of the cold gas. Further deep observations and velocity structure information of the hot phase will be crucial to clear up the dominant process.
Acknowledgments
This work was supported by the ANR grant LYRICS (ANR-16-CE31-0011). ACF acknowledges support by ERC Advanced Grant 340442. ACE acknowledges support from STFC grant ST/P00541/1. BRM acknowledges support from the Natural Sciences and Engineering Research Council of Canada. HRR acknowledges support from an STFC Rutherford fellowship. This paper makes use of the following ALMA data: ADS/JAO.ALMA#2015.1.01198.S (PI: S. Hamer), ADS/JAO.ALMA#2011.0.00374.S, ADS/JAO.ALMA#2012.1.00837.S, ADS/JAO.ALMA#2012.1.00988.S, ADS/JAO.ALMA#2013.1.00862.S, ADS/JAO.ALMA#2013.1.01302.S, ADS/JAO.ALMA#2015.1.00623.S, ADS/JAO.ALMA#2015.1.00644.S, ADS/JAO.ALMA#2015.1.00598.S, ADS/JAO.ALMA#2015.1.00598.S. ALMA is a partnership of ESO (representing its member states), NSF (USA) and NINS (Japan), together with NRC (Canada), MOST and ASIAA (Taiwan), and KASI (Republic of Korea), in cooperation with the Republic of Chile. The Joint ALMA Observatory is operated by ESO, AUI/NRAO and NAOJ.
References
- Babyk, I. V., McNamara, B. R., Tamhane, P. D., et al. 2018, ApJ, submitted [arXiv:1810.11465] [Google Scholar]
- Baldry, I. K., Alpaslan, M., Bauer, A. E., et al. 2014, MNRAS, 441, 2440 [NASA ADS] [CrossRef] [Google Scholar]
- Bayer-Kim, C. M., Crawford, C. S., Allen, S. W., Edge, A. C., & Fabian, A. C. 2002, MNRAS, 337, 938 [NASA ADS] [CrossRef] [Google Scholar]
- Bell, E. F., McIntosh, D. H., Katz, N., & Weinberg, M. D. 2003, ApJS, 149, 289 [NASA ADS] [CrossRef] [Google Scholar]
- Bernardi, M., Alonso, M. V., da Costa, L. N., et al. 2002, AJ, 123, 2159 [NASA ADS] [CrossRef] [Google Scholar]
- Bîrzan, L., Rafferty, D. A., McNamara, B. R., Wise, M. W., & Nulsen, P. E. J. 2004, ApJ, 607, 800 [NASA ADS] [CrossRef] [Google Scholar]
- Bîrzan, L., McNamara, B. R., Nulsen, P. E. J., Carilli, C. L., & Wise, M. W. 2008, ApJ, 686, 859 [NASA ADS] [CrossRef] [Google Scholar]
- Bolatto, A. D., Wolfire, M., & Leroy, A. K. 2013, ARA&A, 51, 207 [Google Scholar]
- Braine, J., & Combes, F. 1992, A&A, 264, 433 [NASA ADS] [Google Scholar]
- Bruzual, G., & Charlot, S. 2003, MNRAS, 344, 1000 [NASA ADS] [CrossRef] [Google Scholar]
- Calzadilla, M. S., Russell, H. R., McDonald, M., et al. 2019, ApJ, 875, 65 [NASA ADS] [CrossRef] [Google Scholar]
- Canning, R. E. A., Sun, M., Sanders, J. S., et al. 2013, MNRAS, 435, 1108 [NASA ADS] [CrossRef] [Google Scholar]
- Cavagnolo, K. W., Donahue, M., Voit, G. M., & Sun, M. 2008, ApJ, 683, L107 [NASA ADS] [CrossRef] [Google Scholar]
- Cavagnolo, K. W., Donahue, M., Voit, G. M., & Sun, M. 2009, ApJS, 182, 12 [NASA ADS] [CrossRef] [Google Scholar]
- Conselice, C. J., Gallagher, III, J. S., & Wyse, R. F. G. 2001, AJ, 122, 2281 [NASA ADS] [CrossRef] [Google Scholar]
- Crawford, C. S., Edge, A. C., Fabian, A. C., et al. 1995, MNRAS, 274, 75 [NASA ADS] [CrossRef] [Google Scholar]
- Crawford, C. S., Allen, S. W., Ebeling, H., Edge, A. C., & Fabian, A. C. 1999, MNRAS, 306, 857 [NASA ADS] [CrossRef] [Google Scholar]
- Crawford, C. S., Hatch, N. A., Fabian, A. C., & Sanders, J. S. 2005, MNRAS, 363, 216 [NASA ADS] [CrossRef] [Google Scholar]
- da Costa, L. N., Pellegrini, P. S., Davis, M., et al. 1991, ApJS, 75, 935 [NASA ADS] [CrossRef] [Google Scholar]
- Dame, T. M. 2011, ArXiv e-prints [arXiv:1101.1499] [Google Scholar]
- David, L. P., Lim, J., Forman, W., et al. 2014, ApJ, 792, 94 [NASA ADS] [CrossRef] [Google Scholar]
- Donahue, M., Sparks, W., Sun, M., et al. 2007, in American Astronomical Society Meeting Abstracts #210, BAAS, 39, 147 [Google Scholar]
- Donahue, M., de Messières, G. E., O’Connell, R. W., et al. 2011, ApJ, 732, 40 [NASA ADS] [CrossRef] [Google Scholar]
- Dubois, Y., Devriendt, J., Teyssier, R., & Slyz, A. 2011, MNRAS, 417, 1853 [NASA ADS] [CrossRef] [Google Scholar]
- Edge, A. 2001, MNRAS, 328, 762 [NASA ADS] [CrossRef] [Google Scholar]
- Ehlert, S., McDonald, M., David, L. P., Miller, E. D., & Bautz, M. W. 2015, ApJ, 799, 174 [NASA ADS] [CrossRef] [Google Scholar]
- Elmegreen, B. G., & Falgarone, E. 1996, ApJ, 471, 816 [NASA ADS] [CrossRef] [Google Scholar]
- Fabian, A. C. 1994, ARA&A, 32, 277 [NASA ADS] [CrossRef] [Google Scholar]
- Fabian, A. 2012, ARA&A, 50, 455 [NASA ADS] [CrossRef] [Google Scholar]
- Fabian, A. C., Nulsen, P. E. J., Atherton, P. D., & Taylor, K. 1982, MNRAS, 201, 17P [NASA ADS] [CrossRef] [Google Scholar]
- Fabian, A. C., Voigt, L. M., & Morris, R. G. 2002, MNRAS, 335, L71 [NASA ADS] [CrossRef] [Google Scholar]
- Fabian, A. C., Walker, S. A., Russell, H. R., et al. 2016, MNRAS, 461, 922 [NASA ADS] [CrossRef] [Google Scholar]
- Farage, C. L., McGregor, P. J., & Dopita, M. A. 2012, ApJ, 747, 28 [NASA ADS] [CrossRef] [Google Scholar]
- Forbes, J. C., & Lin, D. N. C. 2018, AAS J., submitted [arXiv:1810.12925] [Google Scholar]
- Gaibler, V. 2014, Astron. Nachr., 335, 531 [NASA ADS] [CrossRef] [Google Scholar]
- Gaspari, M., & Churazov, E. 2013, A&A, 559, A78 [NASA ADS] [CrossRef] [EDP Sciences] [Google Scholar]
- Gaspari, M., & Sądowski, A. 2017, ApJ, 837, 149 [NASA ADS] [CrossRef] [Google Scholar]
- Gaspari, M., Melioli, C., Brighenti, F., & D’Ercole, A. 2011, MNRAS, 411, 349 [NASA ADS] [CrossRef] [Google Scholar]
- Gaspari, M., Ruszkowski, M., & Sharma, P. 2012, ApJ, 746, 94 [Google Scholar]
- Gaspari, M., McDonald, M., Hamer, S. L., et al. 2018, ApJ, 854, 167 [NASA ADS] [CrossRef] [Google Scholar]
- Hamer, S. L., Edge, A. C., Swinbank, A. M., et al. 2014, MNRAS, 437, 862 [NASA ADS] [CrossRef] [Google Scholar]
- Hamer, S. L., Edge, A. C., Swinbank, A. M., et al. 2016, MNRAS, 460, 1758 [NASA ADS] [CrossRef] [Google Scholar]
- Hamer, S. L., Fabian, A. C., Russell, H. R., et al. 2018, MNRAS, 483, 4984 [NASA ADS] [CrossRef] [Google Scholar]
- Hatch, N. A., Crawford, C. S., Fabian, A. C., & Johnstone, R. M. 2005, MNRAS, 358, 765 [NASA ADS] [CrossRef] [Google Scholar]
- Hitomi Collaboration (Aharonian, F., et al.) 2016, Nature, 535, 117 [Google Scholar]
- Hlavacek-Larrondo, J., McDonald, M., Benson, B. A., et al. 2015, ApJ, 805, 35 [NASA ADS] [CrossRef] [Google Scholar]
- Hoffer, A. S., Donahue, M., Hicks, A., & Barthelemy, R. S. 2012, ApJS, 199, 23 [NASA ADS] [CrossRef] [Google Scholar]
- Hogan, M. T., Edge, A. C., Hlavacek-Larrondo, J., et al. 2015, MNRAS, 453, 1201 [NASA ADS] [CrossRef] [Google Scholar]
- Hogan, M. T., McNamara, B. R., Pulido, F. A., et al. 2017, ApJ, 851, 66 [NASA ADS] [CrossRef] [Google Scholar]
- Huchra, J. P., Macri, L. M., Masters, K. L., et al. 2012, ApJS, 199, 26 [NASA ADS] [CrossRef] [Google Scholar]
- Jaffe, W., Bremer, M. N., & Baker, K. 2005, MNRAS, 360, 748 [NASA ADS] [CrossRef] [Google Scholar]
- Laine, S., van der Marel, R. P., Lauer, T. R., et al. 2003, AJ, 125, 478 [Google Scholar]
- Ledlow, M. J., & Owen, F. N. 1996, AJ, 112, 9 [NASA ADS] [CrossRef] [Google Scholar]
- Li, Y., & Bryan, G. L. 2012, ApJ, 747, 26 [NASA ADS] [CrossRef] [Google Scholar]
- Li, Y., & Bryan, G. L. 2014, ApJ, 789, 153 [NASA ADS] [CrossRef] [Google Scholar]
- Li, Y., Bryan, G. L., Ruszkowski, M., et al. 2015, ApJ, 811, 73 [NASA ADS] [CrossRef] [Google Scholar]
- Li, Y., Ruszkowski, M., & Tremblay, G. 2018, ApJ, 854, 91 [NASA ADS] [CrossRef] [Google Scholar]
- Lidman, C., Suherli, J., Muzzin, A., et al. 2012, MNRAS, 427, 550 [NASA ADS] [CrossRef] [Google Scholar]
- Lim, J., Ohyama, Y., Chi-Hung, Y., Dinh-V-Trung, & Shiang-Yu, W. 2012, ApJ, 744, 112 [NASA ADS] [CrossRef] [Google Scholar]
- Main, R. A., McNamara, B. R., Nulsen, P. E. J., Russell, H. R., & Vantyghem, A. N. 2016, MNRAS, 464, 4360 [NASA ADS] [CrossRef] [Google Scholar]
- McCourt, M., Sharma, P., Quataert, E., & Parrish, I. J. 2012, MNRAS, 419, 3319 [NASA ADS] [CrossRef] [Google Scholar]
- McCourt, M., O’Leary, R. M., Madigan, A.-M., & Quataert, E. 2015, MNRAS, 449, 2 [NASA ADS] [CrossRef] [Google Scholar]
- McDonald, M., Veilleux, S., & Rupke, D. S. N. 2012, ApJ, 746, 153 [NASA ADS] [CrossRef] [Google Scholar]
- McDonald, M., Werner, N., Oonk, J. B. R., & Veilleux, S. 2015, ApJ, 804, 16 [NASA ADS] [CrossRef] [Google Scholar]
- McDonald, M., Gaspari, M., McNamara, B. R., & Tremblay, G. R. 2018, ApJ, 858, 45 [NASA ADS] [CrossRef] [Google Scholar]
- McMullin, J. P., Waters, B., Schiebel, D., Young, W., & Golap, K. 2007, in Astronomical Data Analysis Software and Systems XVI, eds. R. A. Shaw, F. Hill, & D. J. Bell, ASP Conf. Ser., 376, 127 [Google Scholar]
- McNamara, B. R., & Nulsen, P. E. J. 2007, ARA&A, 45, 117 [NASA ADS] [CrossRef] [MathSciNet] [Google Scholar]
- McNamara, B. R., O’Connell, R. W., & Bregman, J. N. 1990, ApJ, 360, 20 [NASA ADS] [CrossRef] [Google Scholar]
- McNamara, B. R., Rafferty, D. A., Birzan, L., et al. 2006, ApJ, 648, 164 [NASA ADS] [CrossRef] [Google Scholar]
- McNamara, B. R., Russell, H. R., Nulsen, P. E. J., et al. 2014, ApJ, 785, 44 [NASA ADS] [CrossRef] [Google Scholar]
- McNamara, B. R., Russell, H. R., Nulsen, P. E. J., et al. 2016, ApJ, 830, 79 [NASA ADS] [CrossRef] [Google Scholar]
- Mittal, R., O’Dea, C. P., Ferland, G., et al. 2011, MNRAS, 418, 2386 [NASA ADS] [CrossRef] [Google Scholar]
- O’Dea, C. P., Baum, S. A., Privon, G., et al. 2008, ApJ, 681, 1035 [NASA ADS] [CrossRef] [Google Scholar]
- Oonk, J. B. R., Jaffe, W., Bremer, M. N., & van Weeren, R. J. 2010, MNRAS, 405, 898 [NASA ADS] [Google Scholar]
- Panagoulia, E. K., Fabian, A. C., & Sanders, J. S. 2013, MNRAS, 438, 2341 [Google Scholar]
- Pimbblet, K. A., Smail, I., Edge, A. C., et al. 2006, MNRAS, 366, 645 [NASA ADS] [CrossRef] [Google Scholar]
- Pizzolato, F., & Soker, N. 2006, MNRAS, 371, 1835 [NASA ADS] [CrossRef] [Google Scholar]
- Postman, M., & Lauer, T. R. 1995, ApJ, 440, 28 [NASA ADS] [CrossRef] [Google Scholar]
- Prasad, D., Sharma, P., & Babul, A. 2015, ApJ, 811, 108 [NASA ADS] [CrossRef] [Google Scholar]
- Prasad, D., Sharma, P., & Babul, A. 2018, ApJ, 863, 62 [NASA ADS] [CrossRef] [Google Scholar]
- Pulido, F. A., McNamara, B. R., Edge, A. C., et al. 2018, ApJ, 853, 177 [NASA ADS] [CrossRef] [Google Scholar]
- Quillen, A. C., Zufelt, N., Park, J., et al. 2008, ApJS, 176, 39 [NASA ADS] [CrossRef] [Google Scholar]
- Rafferty, D. A., McNamara, B. R., Nulsen, P. E. J., & Wise, M. W. 2006, ApJ, 652, 216 [NASA ADS] [CrossRef] [Google Scholar]
- Rafferty, D. A., McNamara, B. R., & Nulsen, P. E. J. 2008, ApJ, 687, 899 [NASA ADS] [CrossRef] [Google Scholar]
- Revaz, Y., Combes, F., & Salomé, P. 2008, A&A, 477, L33 [NASA ADS] [CrossRef] [EDP Sciences] [Google Scholar]
- Rose, T., Edge, A. C., Combes, F., et al. 2019, MNRAS, 485, 229 [NASA ADS] [CrossRef] [Google Scholar]
- Russell, H. R., McNamara, B. R., Edge, A. C., et al. 2014, ApJ, 784, 78 [NASA ADS] [CrossRef] [Google Scholar]
- Russell, H. R., McNamara, B. R., Fabian, A. C., et al. 2016, MNRAS, 458, 3134 [NASA ADS] [CrossRef] [Google Scholar]
- Russell, H. R., McDonald, M., McNamara, B. R., et al. 2017a, ApJ, 836, 130 [NASA ADS] [CrossRef] [Google Scholar]
- Russell, H. R., McNamara, B. R., Fabian, A. C., et al. 2017b, MNRAS, 472, 4024 [NASA ADS] [CrossRef] [Google Scholar]
- Salomé, P., & Combes, F. 2003, A&A, 412, 657 [NASA ADS] [CrossRef] [EDP Sciences] [Google Scholar]
- Salomé, P., & Combes, F. 2004, A&A, 415, L1 [NASA ADS] [CrossRef] [EDP Sciences] [Google Scholar]
- Salomé, P., Combes, F., Edge, A. C., et al. 2006, A&A, 454, 437 [NASA ADS] [CrossRef] [EDP Sciences] [Google Scholar]
- Salomé, P., Combes, F., Revaz, Y., et al. 2011, A&A, 531, A85 [NASA ADS] [CrossRef] [EDP Sciences] [Google Scholar]
- Sanders, J. S., & Fabian, A. C. 2002, MNRAS, 331, 273 [NASA ADS] [CrossRef] [Google Scholar]
- Sanders, J. S., Fabian, A. C., Taylor, G. B., et al. 2016, MNRAS, 457, 82 [NASA ADS] [CrossRef] [Google Scholar]
- Schlafly, E. F., & Finkbeiner, D. P. 2011, ApJ, 737, 103 [NASA ADS] [CrossRef] [Google Scholar]
- Schlegel, D. J., Finkbeiner, D. P., & Davis, M. 1998, ApJ, 500, 525 [NASA ADS] [CrossRef] [Google Scholar]
- Sharma, P., McCourt, M., Quataert, E., & Parrish, I. J. 2012, MNRAS, 420, 3174 [NASA ADS] [CrossRef] [Google Scholar]
- Shin, J., Woo, J.-H., & Mulchaey, J. S. 2016, ApJS, 227, 31 [NASA ADS] [CrossRef] [Google Scholar]
- Simionescu, A., Tremblay, G., Werner, N., et al. 2018, MNRAS, 475, 3004 [NASA ADS] [CrossRef] [Google Scholar]
- Smith, E. P., Heckman, T. M., & Illingworth, G. D. 1990, ApJ, 356, 399 [NASA ADS] [CrossRef] [Google Scholar]
- Solomon, P. M., Rivolo, A. R., Barrett, J., & Yahil, A. 1987, ApJ, 319, 730 [NASA ADS] [CrossRef] [Google Scholar]
- Soto, K. T., Lilly, S. J., Bacon, R., Richard, J., & Conseil, S. 2016, MNRAS, 458, 3210 [NASA ADS] [CrossRef] [Google Scholar]
- Sparks, W. B., Macchetto, F., & Golombek, D. 1989, ApJ, 345, 153 [NASA ADS] [CrossRef] [Google Scholar]
- Sparre, M., Pfrommer, C., & Vogelsberger, M. 2018, MNRAS, 482, 5401 [NASA ADS] [CrossRef] [Google Scholar]
- Taylor, G. B., Fabian, A. C., & Allen, S. W. 2002, MNRAS, 334, 769 [NASA ADS] [CrossRef] [Google Scholar]
- Taylor, G. B., Sanders, J. S., Fabian, A. C., & Allen, S. W. 2006, MNRAS, 365, 705 [NASA ADS] [CrossRef] [Google Scholar]
- Tozzi, P., Gastaldello, F., Molendi, S., et al. 2015, A&A, 580, A6 [NASA ADS] [CrossRef] [EDP Sciences] [Google Scholar]
- Tremblay, G. R., Oonk, J. B. R., Combes, F., et al. 2016, Nature, 534, 218 [NASA ADS] [CrossRef] [Google Scholar]
- Tremblay, G. R., Combes, F., Oonk, J. B. R., et al. 2018, ApJ, 865, 13 [NASA ADS] [CrossRef] [Google Scholar]
- Tremonti, C. A., Heckman, T. M., Kauffmann, G., et al. 2004, ApJ, 613, 898 [NASA ADS] [CrossRef] [Google Scholar]
- Vantyghem, A. N., McNamara, B. R., Russell, H. R., et al. 2016, ApJ, 832, 148 [NASA ADS] [CrossRef] [Google Scholar]
- Vantyghem, A. N., McNamara, B. R., Edge, A. C., et al. 2017, ApJ, 848, 101 [NASA ADS] [CrossRef] [Google Scholar]
- Vantyghem, A. N., McNamara, B. R., Russell, H. R., et al. 2018, ApJ, 863, 193 [NASA ADS] [CrossRef] [Google Scholar]
- Vantyghem, A. N., McNamara, B. R., Russell, H. R., et al. 2019, ApJ, 870, 57 [NASA ADS] [CrossRef] [Google Scholar]
- Voit, G. M. 2018, ApJ, 868, 102 [Google Scholar]
- Voit, G. M., & Donahue, M. 2015, ApJ, 799, L1 [Google Scholar]
- Voit, G. M., Donahue, M., Bryan, G. L., & McDonald, M. 2015, Nature, 519, 203 [NASA ADS] [CrossRef] [EDP Sciences] [Google Scholar]
- Voit, G. M., Meece, G., Li, Y., et al. 2017, ApJ, 845, 80 [NASA ADS] [CrossRef] [Google Scholar]
- Von Der Linden, A., Best, P. N., Kauffmann, G., & White, S. D. M. 2007, MNRAS, 379, 867 [NASA ADS] [CrossRef] [Google Scholar]
- Wagner, A. Y., Bicknell, G. V., & Umemura, M. 2012, ApJ, 757, 136 [NASA ADS] [CrossRef] [Google Scholar]
- Weilbacher, P. M., Streicher, O., Urrutia, T., et al. 2014, in Astronomical Data Analysis Software and Systems XXIII, eds. N. Manset, & P. Forshay, ASP Conf. Ser., 485, 451 [Google Scholar]
- Werner, N., Simionescu, A., Million, E. T., et al. 2010, MNRAS, 407, 2063 [NASA ADS] [CrossRef] [Google Scholar]
- Werner, N., Sun, M., Bagchi, J., et al. 2011, MNRAS, 415, 3369 [NASA ADS] [CrossRef] [Google Scholar]
- Werner, N., Oonk, J. B. R., Canning, R. E. A., et al. 2013, ApJ, 767, 153 [NASA ADS] [CrossRef] [Google Scholar]
- Werner, N., Oonk, J. B. R., Sun, M., et al. 2014, MNRAS, 439, 2291 [NASA ADS] [CrossRef] [Google Scholar]
- Werner, N., McNamara, B. R., Churazov, E., & Scannapieco, E. 2019, Space Sci. Rev., 215, 5 [NASA ADS] [CrossRef] [Google Scholar]
Appendix A: Hα (MUSE) to CO (ALMA) Comparison: Line ratios and velocity maps
 |
Fig. A.1. Hα-to-CO ratios as a function of radius in arcseconds only where CO is detected. We note that the flux of either CO(1-0) or CO(2-1) was used in estimating the Hα-to-CO line flux ratios. The dashed gray lines denote the maximum radial extent of the warm filaments. |
 |
Fig. A.2. Comparison of the Hα MUSE and ALMA CO velocity maps shown on the same velocity and spatial scales and over the same regions. Both velocity maps look very similar. |
 |
Fig. A.3. Left panel: deprojected entropy profiles, including the values of the innermost entropy obtained by extrapolating from the fit at large radii from the ACCEPT catalog (Cavagnolo et al. 2009). We show as a light gray dashed line the best-fitting power-law model to the inner entropy profiles as K ∝ rα, with α varying between 0.65 and 0.9 (K ∝ r2/3; Panagoulia et al. 2013; Babyk et al. 2018) in the central region (labeled in the bottom left of the panel; Werner et al. 2019). We also overplot as a dark gray dashed line a standard cluster entropy profile (External) with scaling law as K ∝ rβ, with β ranging from 1.1 to 1.2. (K ∝ r1.1; Voit et al. 2015; Babyk et al. 2018). The best fits are given in the legend in the upper left of the panel. A Panagoulia profile has also been added with a dotted blue line (Panagoulia et al. 2013) and K ∝ r1.1 profile (Hogan et al. 2017). Middle panel: ratio of the cooling time to free-fall time, tcool/tff, as a function of radius. We highlight tcool/tff = 10 and 20 with horizontal dashed lines because this appears to be the approximate threshold for onset of thermal instabilities in our sample. Right panel: cooling (red curve) and turbulence eddy turnover timescales (blue curve). We also indicate the radius at which the filaments are located (vertical dotted gray line), 10 × tff as a function of radius (dashed green line; see legend at the upper right of the panel). In the left and middle panels, the radial extent of the largest filament is indicated by the colored cross. |
 |
Fig. A.3. continued. |
 |
Fig. A.3. continued. |
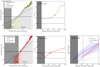 |
Fig. A.3. continued. |
Appendix B: Cold molecular
B.1. Distribution of the cold molecular gas
Centaurus. In projection, the 5.6 kpc CO(1-0) emission in Centaurus is distributed in two main structures: a central broad structure with an extension of ∼2 kpc followed by a large filament that extends to about ∼4.3 kpc to the SE and NW following the ionized gas plume detected in Hα emission and also seen in soft X-ray (Crawford et al. 2005). Several molecular peaks are detected along 4 kpc (20″) inside the southern Hα filament. In addition, a small filament extends to the NE, following the central component with a length of 1 kpc (5″). The width of the molecular filaments in Centaurus is unresolved and is smaller than 0.5 kpc.
From the Fig. 3 (third panel), we note that the molecular gas is distributed preferentially along the peripheries of the radio bubbles from VLA images (red contours) produced by the AGN, and beneath the X-ray cavities detected by Chandra observations. We also note that the molecular filaments match the dust lane detected with the HST Fabian et al. (2016). This cold molecular gas is forming stars across its entire detected extent yielding a low SFR of ∼0.13 M⊙ yr−1 (Mittal et al. 2011), in comparison with the large amount of molecular gas (∼108 M⊙) available to form stars.
Abell S1101. The brightest structures extend over ∼8.8 kpc (8″) to the NS (southern clump) while a second structure is extended over ∼4.4 kpc (4″) to the NS as well (northern clump). A small unresolved clump is found in the SW (western filament) following the brightest Hα emission from the warm ionized nebula; see Fig. 2. Based on Chandra observations we can see that the molecular component is located preferentially around the X-ray cavities displaced by ∼7.5 kpc, which is where the inflated radio bubble from the central AGN formed however; see Fig. 3. In addition, the molecular clouds appear to be closely associated with the abundant dust lane of ∼107 M⊙ detected by the HST observations. Furthermore, the CO(1-0) emission is spatially located with FIR and UV emission, indicating that the cold nebular is forming stars but at a low rate of ∼1–3 M⊙ yr−1 (McDonald et al. 2015).
RXJ1539.5. The molecular gas nebula is distributed in four main components: a central emission that is extended over ∼18 kpc, followed by several filaments. The W–E radial filament extends over ∼20 kpc (left filament), while the W–N filament has an extension of ∼14 kpc (right filament). Finally, a third small filament extends towards the N of the central emission over ∼7 kpc. Unfortunately, VLA images are not available to detect any radio bubbles.
Abell 2597. Recently, Tremblay et al. (2016, 2018) showed ALMA cycle 3 observations of Abell 2597 and its molecular gas using CO(2-1) emission lines, revealing a filamentary emission consistent in projection with optical emission nebula. Furthermore, they found absorption features that arise from cold molecular clouds moving toward the center of the galaxy fuelling the black hole accretion, either via radial or inspiralling trajectories. The CO(2-1) continuum-subtracted emission of Abell 2597 (second panel of Fig. 3) reveals two molecular structures. A central component showing a “V” shape is extending over ∼10 kpc (6.5 arcsec), followed in projection by a southern filament of length ∼7.7 kpc (5″).
PKS 0745−101. The ALMA Cycle 1 observations of PKS 0745−191 BCG of CO(1-0) and CO(3-2) emission lines presented by Russell et al. (2016) resolved the spatial and velocity structure of the cold molecular gas structures at the center of the BCG revealing extended filaments. The CO(1-0) and CO(3-2) moment zero maps of PKS 0745−101 are shown in the second panel of Fig. 3. The CO(1-0) molecular morphology shows a compact and unresolved nebulae extending over 11 kpc (6 ″), while the CO(3-2) emission resolves three clumpy filaments, with extensions of ∼3 kpc (1.6″), ∼3.8 kpc (2.0″), and ∼5 kpc (2.5″) for the SE, SW, and N filaments, respectively. The emission from the SW filament appears to extend across the nucleus as Russell et al. (2016) previously found. Here we note that the CO(1-0) intensity map covers a wide FOV with lower resolution than the CO(3-2) intensity map, explaining the lack of molecular filaments on the CO(1-0) map. We measured a width size for the molecular filaments of 1–2 kpc. Those filaments are projected beneath the X-ray cavities, previously inflated by buoyant radio bubbles from the central AGN. Furthermore, the cold filaments are coincident with low-temperature X-ray gas, bright optical line emission, and dust lanes suggesting that the molecular gas could have formed by gas cooling from uplifted warm gas that cooled in situ. One of the filaments appears to be breaking into clumps at large radius; those may eventually fragment with gas clouds falling back onto the BCG center to fuel the central AGN.
Abell 1795. In Fig. 3 (second panel) we present the CO(2-1) mean flux of Abell 1795 (moment zero), previously reported by Russell et al. (2017b), which reveals a bright peak at the nucleus followed by a curved filament extending N to a second emission peak. A southern filament extends to the SW of the nucleus over ∼6 kpc (5″). The curved filaments appear separated into two components of ∼5 kpc (4″) each. The two filaments are found exclusively around the outer edges of two inner radio bubbles launched by the central AGN, as shown in red contours in the Fig. 3. Furthermore, the N filament is coincident with a strong dust lane revealed in the HST imaging Russell et al. (2017b), similar to the molecular gas, the dust appears along the radio lobes and may have been entrained are formed in situ. The molecular gas emission is also strongly correlated with the Hα line emission observed by the MMTF (Crawford et al. 2005; McDonald et al. 2012) and MUSE, and both nebulae clearly have similar structures with peaks around the nucleus, at the top of the N filament and along the S filament.
Abell 1664. ALMA Cycle 0 observations of Abell 1664 using CO(1-0) and CO(3-2) emission lines were presented in detail by Russell et al. (2014). In the second panel of Fig. 3, the continuum-subtracted CO(1-0) and CO(3-2) integrated emission are shown, in which the CO(1-0) emission extends over ∼21 kpc (9.5″) in a complex morphology. The CO(1-0) emission line morphology presents a central components of 8 kpc (3.5″), followed by two small filaments to the NE and SW extending over 4.5 kpc and 8 kpc, respectively. Instead, the CO(3-2) observations spatially resolved the inner region of the galaxy cluster, which appears to be very clumpy and disturbed. It is possible to separate the filament into two gas blobs along its length of ∼8 kpc (3.5″). These structures are also coincident with low optical–ultraviolet surface brightness, which could indicate dust extinction associated with each clump Russell et al. (2014).
2A0335+096. In Fig. 3 (second panel) we show the ALMA observations 2A0335+096 (also called RXCJ0338.6+0958) using CO(1-0) and CO(3-2) emission line, reported previously by Vantyghem et al. (2016). In both molecular emission we detected similar structures, where the gas appears to be distributed over several clumpy and dusty filaments. A nucleus emission is present extending over 2″ followed by a dusty NW filament along 3 kpc (4.2″). In CO(1-0) we detect a distant NW clumpy filament of 6.3 kpc (9″) in length, located at 7 kpc (10″) from the nucleus. The cold molecular and ionized warm filaments from Hα MUSE observations trails an X-ray cavity, suggesting that the gas has cooled from low-entropy gas that could have been lifted out of the cluster core, becoming thermally unstable.
Phoenix-A.Russell et al. (2017a) reported the ALMA observations of CO(3-2) lime emission in Phoenix-A, revealing a massive reservoir of molecular gas, fueling a high SFR and powerful AGN activity. The CO(3-2) molecular emission of Phoenix-A reveals a peak at the galaxy center extending from the NE to the SW across the nucleus of ∼27 kpc (3.7″; see second panel of Fig. 3 ), followed by two filaments to the NW and SE of ∼10 kpc (1.5″) and ∼20 kpc (3.0″), respectively. The central component is extended to the S of the nucleus, forming a curved filament along ∼17 kpc (2.5″). The ALMA observations show that the molecular filaments are located along the peripheries of the huge radio bubbles filled with relativistic plasma into the hot X-ray atmospheres. Furthermore, the molecular filaments in Phoenix-A appear to be located preferentially along the dust lane detected by the HST broadband imaging. Similar to the molecular gas, the dust appears along the radio lobes and may have been formed in situ within cooling gas.
Abell 3581. In Fig. 3 (second panel) we can see that the distribution of molecular gas, based on the CO(2-1) emission line for Abell 3581, is located in several dusty perpendicular filaments. The molecular gas reveals a peak at the centre of the galaxy followed by a northern filament extending over a long of 2.6 kpc (6″). Two E–W parallel filaments are found extending along 4.3 kpc (10″), the one at the top is showing a peak at the center of the filament. In addition, a third high-velocity E–W filament is located at the end of the northern filament along 1 kpc (2.5″). We note that the molecular emission from ALMA observations closely coincides with the dust lanes detected using HST observations (Canning et al. 2013). In addition, we found that the molecular emission and the dust lanes in the southeast of the nucleus also coincide with the outer edge of the radio bubbles. The molecular gas emission is also strongly correlated with the brightest Hα emission observed by MUSE observations. Both nebulae have very similar structures, however a significant difference occurs at the peak of the Hα emission. Where the central galaxy and the AGN is located, we found a lack of molecular emission, similar to what was found in Abell 1795.
RXJ0820.9+0752. Recently, Vantyghem et al. (2017) reported ALMA Cycle 4 observations of CO(1-0), CO(3-2), and 13CO(3-2) emission lines, one of the first detections of 13CO line emission in galaxies. The molecular gas originates from two clumps that are spatially offset from the galactic center, surrounded by a diffuse emission. In Fig. 3 (second panel) we can identify two clumps of molecular gas that are seen in both maps and account for most of the molecular emission, with each clump extending around ∼3 kpc (1.5″), and surrounded by more diffuse emission. In CO(1-0) emission, we identify two filaments extending toward the NW and SW along 8 kpc (∼4″) each. The CO(3-2) emission appears to be more clumpy than the CO(1-0) emission (resolution effect). It reveals a small filament that goes from the nucleus to the SE along 2 kpc (∼1″).
Abell 262 and Hydra-A. We found the presence of a compact molecular disk in two systems of our sample, Abell 262 (BCG called NGC 0708) and Hydra-A (Rose et al. 2019), from CO(2-1) observations. Both BCGs show a double-peaked line profile that is typical of disk kinematics. From Fig. 3 we can see that in Hydra-A the molecular gas is hosted in a compact disk (∼1.2 kpc) extending over 5.2 kpc (5″) and that coincides with the ionized and warm gas found with SINFONI Hamer et al. (2014) and MUSE observations. Similarly, the molecular gas in Abell 262 is hosted in a compact disk extending over 2.4 kpc (7.5″). From the second panel of Fig. 3 we note that in both sources the rotation is in a plane perpendicular to the projected orientation of the radio jets from the VLA observations, hinting at a possible connection between the cooling gas and the accretion of material onto the black hole.
Abell 1835. The ALMA cycle 0 observations of CO(1-0) and CO(3-2) emission line of Abell 1835, reported previously by McNamara et al. (2014), reveal that molecular gas is found in a compact region with an extent of ∼25 kpc (6.5″), based on CO(1-0); see second panel of Fig. 3. Alternatively, the CO(3-2) emission extends over ∼13.5 kpc (3.5″), showing three radial filaments relative to the nucleus of ∼1″ each (3.9 kpc). Given the lack of resolution of the ALMA band 3 these filaments were unresolved in the CO(1-0) emission. Furthermore, the limited FOV on ALMA band 7 causes these filaments to appear less extended in CO(3-2). A radial variation of the line ratio is also possible but requires higher spatial resolution 3 mm observations for an accurate comparison.
M 87.Simionescu et al. (2018) reported molecular gas using the CO(2-1) emission line from ALMA observations in a region located at the very SE of the nucleus of M 87. Extended blueshifted molecular emission with a lower velocity dispersion is detected there. The CO(2-1) emission is found only outside the radio lobe of the AGN seen in the VLA image, while the filament seen in other wavelengths extends further inwards. This suggests that the molecular gas in M 87 could have been destroyed or excited by AGN activity, either by direct interaction with the radio plasma, or by the shock driven by the lobe into the X-ray-emitting atmosphere. Finally, the CO(2-1) molecular filament in M 87 located to the SE of the nucleus extends along ∼0.6 kpc with a median width of ∼0.3 kpc.
The cold molecular distribution in this sample tends to be organized in a central/nuclear component, located at the center of the galaxy. This is surrounded by a network of long clumpy filaments. However, in M 87 and RXJ0821+0752, no significant molecular emission is detected on the nucleus of the BCG. In general, the CO distribution is morphologically co-spatial with dust lanes detected by HST observations and the Hα emission.
B.2. Velocity structures of the cold molecular gas
Centaurus. In Centaurus the molecular gas velocity is found in projection within −100 to +250 km s−1 relative to the systemic velocity of the galaxy and shows two different velocity components; see Fig. 3 (third and fourth panels). The extended southern filament (referred to as “the plume”) is characterized by a smooth velocity gradient going from +150 to +250 km s−1 across its ∼4 kpc, increasing in velocity at larger radii. The velocity of the filament is slower near the nucleus than at its larger distance. The filament has a narrow velocity dispersion lying around 30 km s−1. However, at the northern position, the filament broadens in velocity dispersion, 90–150 km s−1. This could be a visual effect due to the superposition of another perpendicular filament that is located behind the BCG, making it impossible to detect. A central gas component is present with a velocity dispersion below 100 km s−1 and moving with a roughly constant velocity of +30 km s−1. Finally a small blueshifted filament is found going W–E to the north of the central component and showing a shallow gradient of −160 to −70 km s−1 at decreasing radii. The smooth velocity gradients and narrow velocity dispersion reveal a steady, ordered flow of molecular gas.
RXJ1539.5. The molecular gas of RXJ1539.5 has a complex velocity structure across its spatial extenst and appears to be very disturbed; see Fig. 3 (third and fourth panels). The projected gas velocities that span ±250 km s−1 are spread almost symmetrically around the systemic velocity of the galaxy. The central component is characterized by a broad velocity dispersion of 120 km s−1. The eastern clumpy filaments show largely quiescent structures with no monotonic or coherent gradient along its structure. The nebula has roughly constant velocity centroids from +50 to +100 km s−1 and with narrow velocity dispersion, 50–80 km s−1. On the other hand, the clumpy western filament shows a shallow gradient of projected velocities that span from −200 to +200 km s−1 with an almost constant velocity dispersion of 30–50 km s−1. However at the NW terminus of the western filament the velocity dispersion broadens to > 180 km s−1. Finally the blueshifted northern filament shows a projected smooth velocity gradient that spans over −150 to −250 km s−1 from SN at increasing radii.
Abell S1101. The cold molecular gas velocities in Abell S1101 lie within +30 to −250 km s−1 around the systemic velocity of the galaxy and show two different filamentary structures, SN and SW filaments, both coming from the nuclear region of the BCG; see Fig. 3 (third and fourth panels). These structures present signs of a shallow velocity gradient across its 1 kpc length, decreasing in velocity while increasing in galactocentric radius. This is consistent with either an inflow or an outflow of cold gas, since the inclination is not known. The SN filament goes from +20 through −100 km s−1 relative to the systemic velocity of the galaxy while increasing in radius, with a low velocity dispersion that lies below 40 km s−1. Instead, the SW filament goes from +30 to −250 km s−1 as we move outside of the nucleus, with a narrow velocity dispersion lying in the range of 40–70 km s−1.
Abell 2597. The molecular gas velocities in Abell 2597 (Tremblay et al. 2016, 2018) lie within −150 and +150 km s−1 relative of the systemic velocity of the galaxy. The velocity structures are complex across its spatial extent; see Fig. 3 (third and fourth panels). The central components show a roughly symmetrical velocity structure lying within −100 to 100 km s−1, suggesting some rotation. While the southern filament shows largely quiescent structure along its extent, going from +30 to +100 km s−1 and with a velocity dispersion of 30 to 60 km s−1.
PKS 0745−191. The cold molecular projected velocities of the CO(1-0) line emission of PKS 0745−191 (Russell et al. 2016) lie in a velocity gradient within −60 to +40 km s−1 from the systemic velocity; see Fig. 3 (third and fourth panels) and showing low velocity dispersions that lie below 70 km s−1, with the broadest component close to the nucleus of the galaxy cluster. The projected velocities of the molecular gas in the CO(3-2) line emission show more complex motions within the nebula. They are found in a narrow range of projected velocities, −60 to +40 km s−1, and have a low velocity dispersion as well, below 100 km s−1 across the most extended structure.
Abell 1664. In Abell 1664 (Russell et al. 2014) the molecular gas projected velocities of the CO(1-0) emission line is blueshifted from +20 to −650 km s−1 from S to N; see Fig 3 (third and fourth panels). Furthermore, the velocity dispersion of the gas lies below 250 km s−1. tThe projected velocities from the CO(3-2) emission lie within −600 to +150 km s−1 from the systemic velocity. The velocity dispersions lie below 350 km s−1. The SE component appears to be moving in a quiescent structure going from +90 to +120 km s−1 with a velocity dispersion of 70 km s−1, while the NW component has a more disturbed velocity structure blueshifted from −130 to −600 km s−1 with a velocity dispersion below 350 km s−1. Russell et al. (2014) suggest that those high-velocity gas structures are consistent with a massive outflow projected in front of the BCG and moving towards us along the line of sight. This is supported by the low optical emission also found in this region, which is consistent with a highly dusty region (the cold gas then being in the foreground).
Abell 1835. In Abell 1835 (McNamara et al. 2014) the projected velocities of the molecular gas of the CO(1-0) emission line lie in a smooth gradient that goes from −150 to +120 km s−1 along its extent; see Fig 3 (third and fourth panels). Furthermore, the emission shows low velocity dispersion, lying well below 130 km s−1. Similarly, the projected velocity structures of the CO(3-2) emission line lie between −120 and +120 km s−1, and the velocity dispersion below 110 km s−1.
Abell 2597. In Abell 2597 (Tremblay et al. 2016, 2018) the velocities of the molecular gas of the CO(2-1) emission line of the central “V-shaped” clumps lie in a complex and turbulent velocity distribution, suggesting an interaction with the radio jet from the AGN, that goes from −100 to +200 km s−1; see Fig 3 (third and fourth panels). The SW filament shows a velocity gradient from +5 to +40 km s−1 (from north to south). This suggests that the filament could be lifted gas from the center of the galaxy by a shock pressure triggered by one of the radio bubbles. The velocity dispersions of the filament are low (30–60 km s−1) in comparison to the central component (30–150 km s−1).
M 87. The small clump detected in M 87 (Simionescu et al. 2018) shows a blueshifted velocity gradient that goes from −150 to −110 km s−1; see Fig. 3 (third and fourth panels). The measured velocity dispersion appears remarkably quiescent ∼30 km s−1.
Abell 1795. In Abell 1795 (Russell et al. 2017b) the projected molecular velocities of the CO(2-1) emission line of the curved filaments show a smooth gradient that goes from −170 to +190 km s−1 relative to the system velocity of the BCG; see Fig 3 (third and fourth panels), while the SW filament goes from −60 to 0 km s−1 in the N–S direction consistent with an outflow of gas by southern radio lobes from the AGN. The velocity dispersion of Abell 1795 is very quiescent lying well below 60 km s−1.
Phoenix-A. The projected velocities of molecular gas traced with the CO(2-1) emission line in Phoenix-A (Russell et al. 2017a) show a very complex velocity structure; see Fig. 3 (third and fourth panels). All three extended filaments have ordered velocity gradients along their lengths and show low velocity dispersions lying below 70 km s−1. The velocities at the furthest extent of each filament increase towards to the galaxy nucleus with the highest velocity at the smallest radii, going from +420 to +180 km s−1 for the NE and SE filaments, while the velocity gradient along the NW filament goes from +200 to 0 km s−1 decreasing at the nucleus. The SW filament shows a shallow gradient where the velocity increases with decreasing radius from +160 to +220 km s−1. Finally, the central compact component of the emission at the center of the galaxy shows a separate structure with a much higher velocity dispersion of 200 km s−1 and a velocity gradient that goes from −90 to +250 km s−1 across the nucleus and perpendicular to the filaments. This is consistent with ordered motions around the nucleus.
RXJ0820.9+0752. The cold molecular gas in RXJ0820.9+0752 (Vantyghem et al. 2017) from CO(1-0) and CO(3-2) emission lines are lying in two main components surrounded by a smooth emission outside of the nuclear region of the galaxy; see Fig. 3 (third and fourth panels). The velocity maps show that two components are moving with low regular velocities that go from +70 to +40 km s−1 across the two main components. While the SE filament in the CO(3-2) emission line shows a shallow gradient where the velocity decreases with increasing radius from −10 to −70 km s−1, the NE filament is moving with a constant velocity of a few ∼10 km s−1. In general the smooth emission that surrounds the two components shows low velocity dispersion lying below 30 km s−1, while the two components present higher velocity dispersions around 60 km s−1.
2A 0335+096. In 2A 0335+096 (Vantyghem et al. 2016) the cold molecular gas projected velocities of the CO(1-0) and CO(3-2) emission lines are co-moving; see Fig. 3 (third and fourth panels). A large velocity gradient is present within the core of the BCG going from −140 to +200 km s−1 increasing from the SN across the nucleus. The blueshifted emission is relatively broad, with a velocity dispersion around 100 km s−1, while the redshifted emission is considerably narrower with a velocity dispersion of 50 km s−1. The NE filament seen in the CO(1-0) emission maps shows a smooth gradient that goes from +10 to −110 km s−1 decreasing with radii with a relatively narrow velocity dispersion of 50–60 km s−1 across the filament.
Abell 3581. The velocities of the cold molecular gas in Abell 3581 are embedded in two main filaments, both showing ordered velocity gradients along their lengths and decreasing in velocity at large radii; see Fig. 3 (third and fourth panels). The S–N filaments show that the molecular gas is moving from +120 to −190 km s−1 from the center of the system towards the outer regions, with a broader velocity dispersion component in the central region of 130 km s−1 and decreasing at 30 km s−1 outside. The E–W filament shows a clear velocity gradient that goes from +140 to −10 km s−1 and increases with radius with a narrow velocity dispersion of around 30 km s−1. A S–W orientated high-velocity filament is found at ∼1.5 kpc (3″) north of the galaxy cluster center, moving with almost constant projected line-of-sight velocity, −510 to −580 km s−1 across its extent.
Abell 262 and Hydra-A. Abell 262 and Hydra-A show velocity maps and double peak spectral profiles consistent with a molecular rotating disk; see Fig. 3 (third and fourth panels). In Abell 262 the molecular gas gradient goes from −240 to +240 km s−1 increasing from the S to N and showing a central broader component with a velocity dispersion of around 120 km s−1, decreasing towards large radii. Similarly, the molecular gas in Hydra-A (Rose et al. 2019) is moving in a smooth gradient that goes from −300 to +300 km s−1, with a broader velocity dispersion component at the center of the disk of 100 km s−1 and a narrow velocity dispersion lying below 70 km s−1. A narrow continuum redshifted absorption feature is found at ∼−40 km s−1 from the systemic velocity located near the galaxy nucleus. This shows that those absorption features are cast in inflowing cold molecular clouds, eclipsing our line of sight to the black hole continuum, similarly to Abell 2597 (Tremblay et al. 2016).
In general, most of the sources show highly disturbed cold-gas kinematics, mainly due to the projection of several filaments, which are inflowing or outflowing. Two sources shows clear evidence of a nuclear rotating disk. The molecular velocities, on average, are relatively low, below 400 km s−1, and the velocity dispersion is found to be broader at the center, where the AGN is located, and highly narrow (< 100 km s−1) along the filaments.
All Tables
All Figures
|
Fig. 1. ALMA continuum observations of Centaurus (114 GHz), RXJ1539.5−8335 (107 GHz), and Abell S1101 (109 GHz). The black contours are relative to rms noise in each of the data sets and were set to: 3σ, 10σ, 25σ, 50σ, 100σ, 200σ, and 300σ. The beam is plotted in white at the bottom left side of each panel. The red contours indicate the radio emission from the VLA observations at 1.58 GHz (L-band; 0.57 kpc resolution) for Centaurus and 1.46 GHz (L-band; 6 kpc resolution) for Abell S1101. The mm continuum maps are dominated by the synchrotron emission from the AGN at the galaxy center. |
| In the text | |
|
Fig. 2. Logarithmically scaled Hα flux maps from MUSE observations overlaid with contours from the CO(1-0) integrated intensity maps for three new ALMA sources: Centaurus (left panel), RXCJ1539.5−8335 (middle panel), and Abell S1101 (right panel). The co-spatial and morphological correlation between the warm ionized and cold molecular nebulae is clear in these maps. The CO(1-0) emission has been continuum-subtracted and binned from −300 km s−1 to +300 km s−1. The ALMA beam is shown in the upper right corner of each panel. The CO(1-0) contours for Centaurus are: 3σ, 5σ, 7σ, for RXCJ1539.5−8335 are: 3σ, 10σ, 30σ, 50σ, 70σ, etc., and for Abell S1101 are: 3σ, 5σ, 7σ. In the panel showing the data for Centaurus, the small green circle indicates the location of the highest surface brightness Hα emission without any CO emission (see text for details). |
| In the text | |
|
Fig. 3. First panel of each row: Chandra X-ray image with VLA radio contours overlaid in red. Dashed white lines indicate previously identified X-ray cavity positions. Black contours represent the distribution of the cold molecular gas. Second panel of each row: optical image from HST overlaid with black contours representing the distribution of the cold molecular gas. We show Hα emission distribution as orange contours. The first two panels cover the same area. Panels 3−5 from the left along each row: the three panels are, in order from left to right, the first-, second-, and third-moment maps of the ≥3σ CO emission (i.e., intensity map, integrated intensity velocity map, and velocity dispersion map). All source names are indicated at the top right in the first panel of each row and the contents of each image is given in the upper right of each panel. In the moment-zero map, the red contours represent the radio emission from VLA observations from 1.58 GHz for Centaurus, 1.46 GHz for Abell S1101, 1.46 GHz for PKS 0745−191, 1.45 GHz for Abell 262 and 4.89 GHz for Hydra-A, 4.86 GHz for Abell 2597, 4.91 GHz for M 87, 4.19 GHz for Abell 1795, 4.89 GHz for 2A 0335+096, and 1.46 GHz for PKS 0745−191. The white cross indicates the position of the mm-continuum source. The velocity dispersion sometimes appears high because of the presence of multiple velocity components; each component has a small velocity dispersion. |
| In the text | |
|
Fig. 3. continued. |
| In the text | |
|
Fig. 3. continued. |
| In the text | |
|
Fig. 3. continued. |
| In the text | |
|
Fig. 4. Maps of the ratio between the Hα and CO linear normalized flux ratio, line-of-sight velocity difference and velocity dispersion ratio for Centaurus, RXJ1539.5, Abell S1101, Abell 2597, Abell 3581, PKS 0745−191, Abell 1795, RXJ0820.9+0752, 2A0335+096, and Hydra-A from ALMA and MUSE observations. Those maps were made by dividing the corresponding MUSE and ALMA moment maps, respectively. We smoothed the datacube to account for different spatial resolutions (see text for details). Furthermore, the velocity dispersion ratio map shows that, on average, the Hα velocity dispersion is broader than that for CO by a factor of two to three. |
| In the text | |
|
Fig. 4. continued. |
| In the text | |
|
Fig. 5. Molecular mass ratio from IRAM observations (blue leftward-pointing triangles) and those based on extrapolation of the CO measurements assuming a constant Hα-to-CO flux ratio (red stars; see text for details) over total molecular masses from ALMA. The IRAM measurements are taken from Edge (2001), Salomé & Combes (2003) and Pulido et al. (2018). The measured and expected mass of the molecular gas in RXJ0821+0752 is almost the same. Indeed the ratio of expected to measured molecular mass from ALMA and IRAM is close to unity, between 1.2 and 1.4, suggesting that ALMA has detected a significant fraction of the molecular mass. These mass comparisons are all based on the same fluxes, and therefore are not affected by the CO-to-H2 conversion factor. |
| In the text | |
|
Fig. 6. Left panel: ratio of hot mass (measured at the radius of the cold filaments) to total molecular mass. The equal ratio is indicated by a dashed line. The lengths of the cold filaments, rcold, are given in the bottom left-hand corner in kiloparsecs. Right panel: mass deposition rate (measured at rcold) against total molecular mass. The time required for the X-ray cooling to fuel the observed molecular gas mass is indicated by the dashed lines for guidelines at 108 yr and 109 yr. The cooling times measured at rcold are indicated in the top left-hand corner. |
| In the text | |
|
Fig. 7. Deposition rate as a function of radius. The radial extent of the filaments is indicated with crosses and color-coded for each source. The deposition rate profiles are steeply increasing with the radii up to roughly the length of the warm filaments. |
| In the text | |
|
Fig. 8. Left panel: deprojected cooling time profiles, tcool. The dotted black horizontal lines in the left panel indicate a constant cooling time of 5 × 10⁹ yr, the observation-based upper-limit for the onset of nebular emission or/and recent star formation (Cavagnolo et al. 2008; Rafferty et al. 2008). The color of each line corresponds to a specific source as given in the legend in the upper left corner. The radial extent of the filaments is indicated with crosses and color-coded for each source. Right panel: free-fall time vs. radius for the different sources of our sample. As shown by McNamara et al. (2016), Hogan et al. (2017) and Pulido et al. (2018), the free-fall time profiles in the central region of interest lie on top of each other while the cooling times do not, leading to the conclusion that the driving parameter in the tcool/tff ratio is the cooling time. |
| In the text | |
|
Fig. 9. Left panel: ratio of the cooling time to free-fall time, tcool/tff, as a function of radius. The corresponding source for each line is colored according to the legend in the upper left of the panel. We highlighted tcool/tff = 10 and 20 with a horizontal dashed line, which appears to be the approximate threshold for the onset of thermal instabilities (e.g., Li et al. 2015). Right panel: ratio of the cooling time to the eddy time as a function of radius. We highlight the C = tcool/teddy = σv/vcool = 1 with a horizontal dashed line, which shows the extent of the condensation region and can then be used to assess the multiphase nature of the gas in the BCG systems. We indicated the maximum radial extent of the filaments with colored crosses for each source (see legend in the upper-left corner). |
| In the text | |
|
Fig. A.1. Hα-to-CO ratios as a function of radius in arcseconds only where CO is detected. We note that the flux of either CO(1-0) or CO(2-1) was used in estimating the Hα-to-CO line flux ratios. The dashed gray lines denote the maximum radial extent of the warm filaments. |
| In the text | |
|
Fig. A.2. Comparison of the Hα MUSE and ALMA CO velocity maps shown on the same velocity and spatial scales and over the same regions. Both velocity maps look very similar. |
| In the text | |
|
Fig. A.3. Left panel: deprojected entropy profiles, including the values of the innermost entropy obtained by extrapolating from the fit at large radii from the ACCEPT catalog (Cavagnolo et al. 2009). We show as a light gray dashed line the best-fitting power-law model to the inner entropy profiles as K ∝ rα, with α varying between 0.65 and 0.9 (K ∝ r2/3; Panagoulia et al. 2013; Babyk et al. 2018) in the central region (labeled in the bottom left of the panel; Werner et al. 2019). We also overplot as a dark gray dashed line a standard cluster entropy profile (External) with scaling law as K ∝ rβ, with β ranging from 1.1 to 1.2. (K ∝ r1.1; Voit et al. 2015; Babyk et al. 2018). The best fits are given in the legend in the upper left of the panel. A Panagoulia profile has also been added with a dotted blue line (Panagoulia et al. 2013) and K ∝ r1.1 profile (Hogan et al. 2017). Middle panel: ratio of the cooling time to free-fall time, tcool/tff, as a function of radius. We highlight tcool/tff = 10 and 20 with horizontal dashed lines because this appears to be the approximate threshold for onset of thermal instabilities in our sample. Right panel: cooling (red curve) and turbulence eddy turnover timescales (blue curve). We also indicate the radius at which the filaments are located (vertical dotted gray line), 10 × tff as a function of radius (dashed green line; see legend at the upper right of the panel). In the left and middle panels, the radial extent of the largest filament is indicated by the colored cross. |
| In the text | |
|
Fig. A.3. continued. |
| In the text | |
|
Fig. A.3. continued. |
| In the text | |
|
Fig. A.3. continued. |
| In the text | |
Current usage metrics show cumulative count of Article Views (full-text article views including HTML views, PDF and ePub downloads, according to the available data) and Abstracts Views on Vision4Press platform.
Data correspond to usage on the plateform after 2015. The current usage metrics is available 48-96 hours after online publication and is updated daily on week days.
Initial download of the metrics may take a while.