Fig. 2.
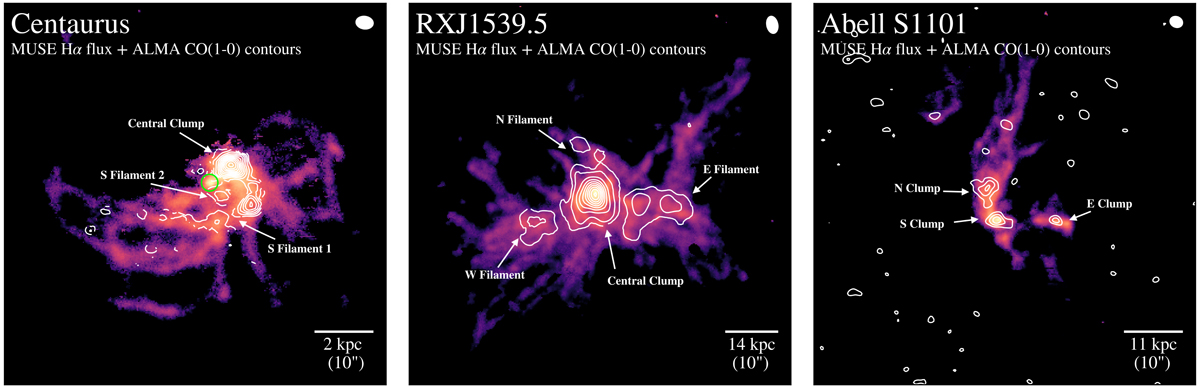
Logarithmically scaled Hα flux maps from MUSE observations overlaid with contours from the CO(1-0) integrated intensity maps for three new ALMA sources: Centaurus (left panel), RXCJ1539.5−8335 (middle panel), and Abell S1101 (right panel). The co-spatial and morphological correlation between the warm ionized and cold molecular nebulae is clear in these maps. The CO(1-0) emission has been continuum-subtracted and binned from −300 km s−1 to +300 km s−1. The ALMA beam is shown in the upper right corner of each panel. The CO(1-0) contours for Centaurus are: 3σ, 5σ, 7σ, for RXCJ1539.5−8335 are: 3σ, 10σ, 30σ, 50σ, 70σ, etc., and for Abell S1101 are: 3σ, 5σ, 7σ. In the panel showing the data for Centaurus, the small green circle indicates the location of the highest surface brightness Hα emission without any CO emission (see text for details).
Current usage metrics show cumulative count of Article Views (full-text article views including HTML views, PDF and ePub downloads, according to the available data) and Abstracts Views on Vision4Press platform.
Data correspond to usage on the plateform after 2015. The current usage metrics is available 48-96 hours after online publication and is updated daily on week days.
Initial download of the metrics may take a while.