Fig. 1.
Download original image
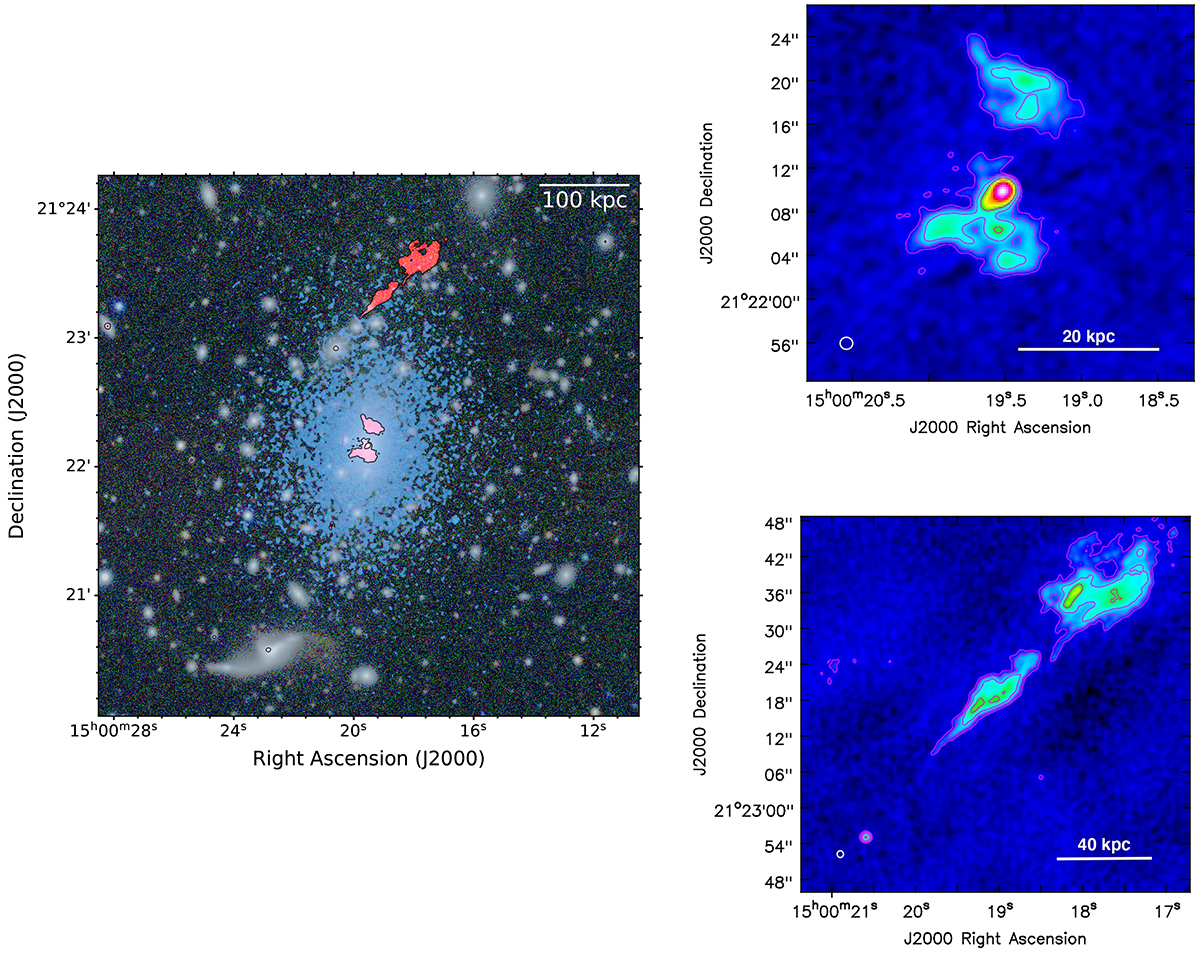
Multiwavelength view of Abell 2009. Left panel: In this image, the radio emission at 1.5 GHz observed with the JVLA telescope and the X-ray emission detected by the Chandra telescope are shown in red and blue, respectively. Both emissions are overlaid on an optical image from the DESI survey for a comprehensive view of the system. Upper right panel: 1.5 GHz JVLA radio image zoomed on the BCG, at a resolution of 1.2″ × 1.1″. The rms value is σrms = 19 μJy/beam. Magenta contour levels are taken at 3, 6, 12, 24 × σrms. Lower right panel: 1.5 GHz JVLA radio image zoomed on the northern radio galaxy, at a resolution of 1.2″ × 1.1″. The rms value is σrms = 19 μJy/beam. Magenta contour levels are taken at 3, 6, 12, 24 × σrms.
Current usage metrics show cumulative count of Article Views (full-text article views including HTML views, PDF and ePub downloads, according to the available data) and Abstracts Views on Vision4Press platform.
Data correspond to usage on the plateform after 2015. The current usage metrics is available 48-96 hours after online publication and is updated daily on week days.
Initial download of the metrics may take a while.