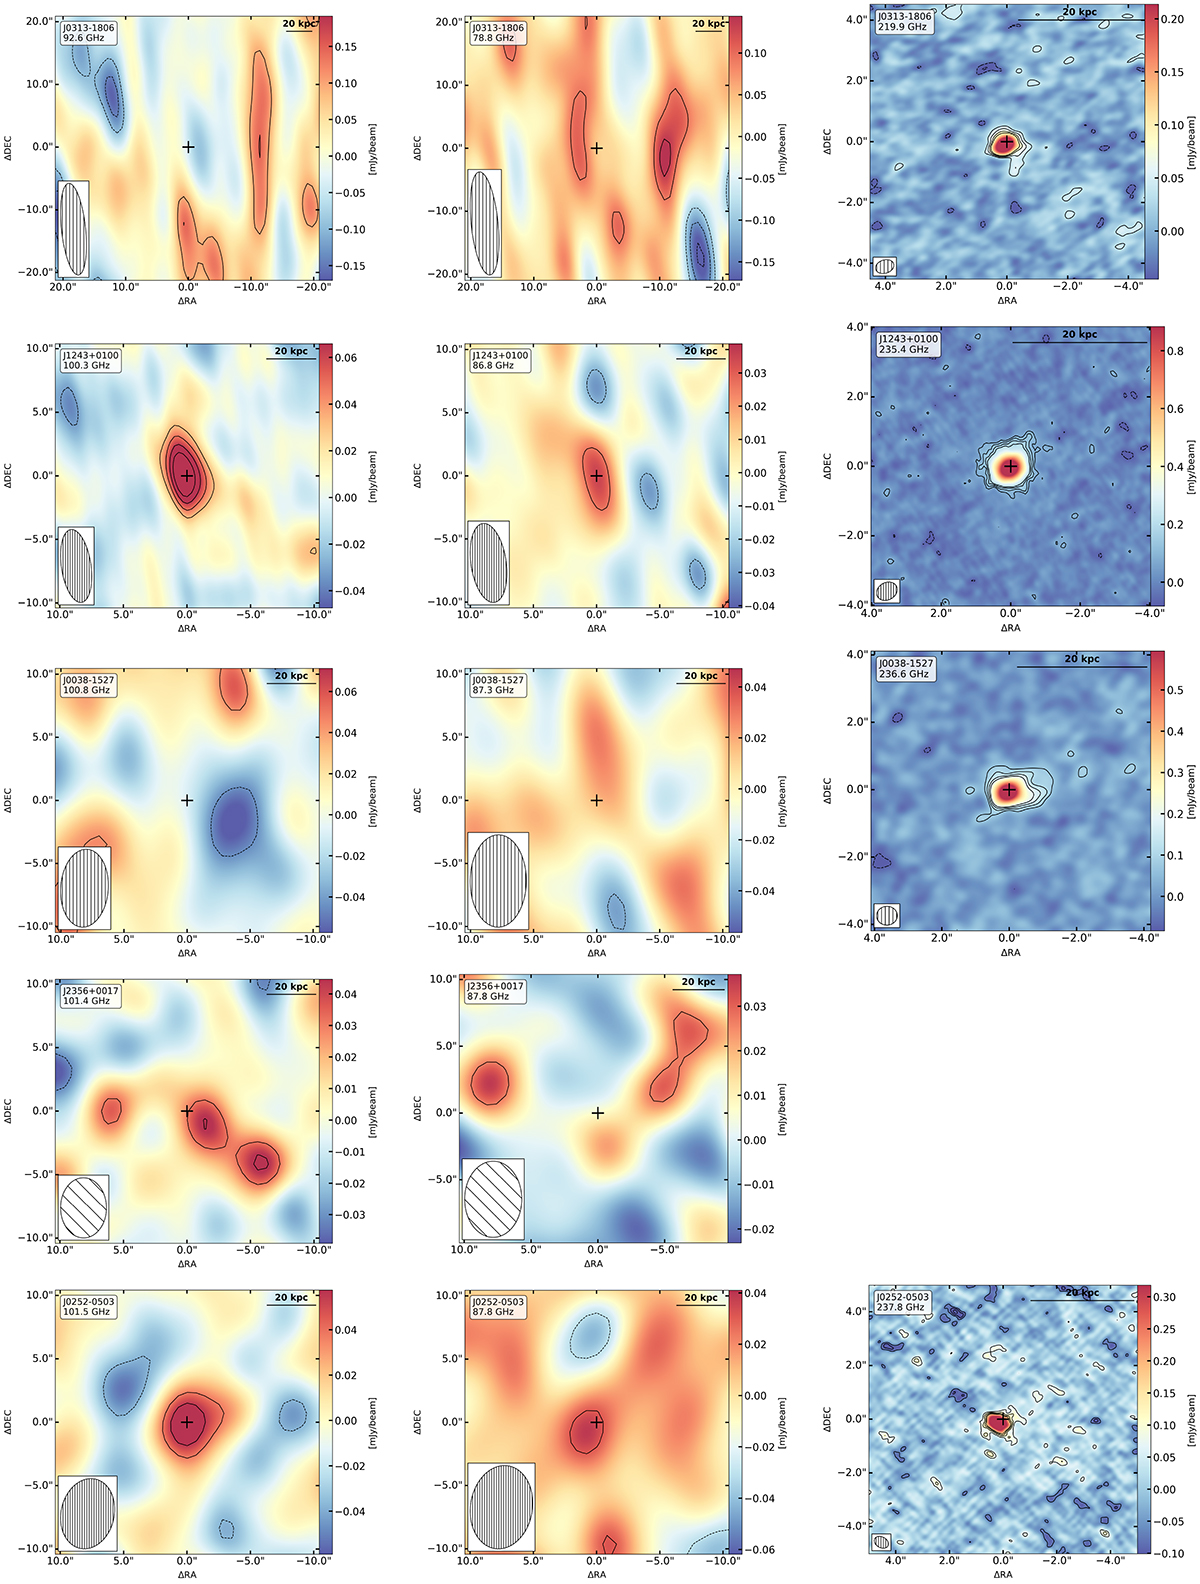
Fig. B.1.
Download original image
Continuum maps. The source name and the observed frequency are in the upper-left corner. The optical position of the quasar is reported with a black cross. Contour levels are -3, -2, 2, 3, 4, and 5 σ significance; the RMS is listed in Table 1. The clean beam for each observation is shown in the lower-left corner of the diagram, and the corresponding size is reported in Table 1.
Current usage metrics show cumulative count of Article Views (full-text article views including HTML views, PDF and ePub downloads, according to the available data) and Abstracts Views on Vision4Press platform.
Data correspond to usage on the plateform after 2015. The current usage metrics is available 48-96 hours after online publication and is updated daily on week days.
Initial download of the metrics may take a while.