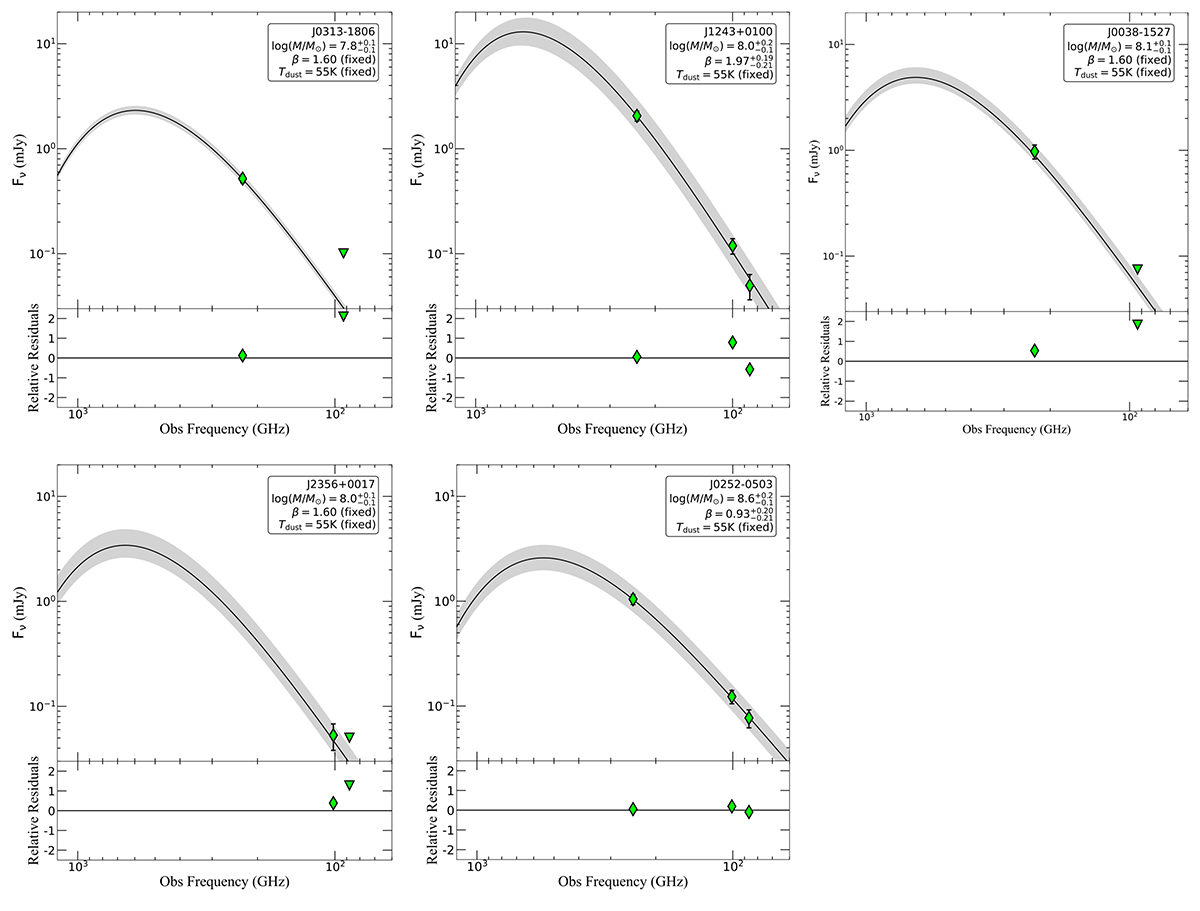
Fig. A.1.
Download original image
FIR SED. Observed fluxes and upper limits are shown as green diamonds and triangles, respectively. The best-fit model is the black line, and the corresponding parameters (namely β, Td, and Md) are reported in each panel. The gray-shaded region represents the 68% confidence interval of the best-fit parameters. Relative residuals are shown in the lower box of each panel.
Current usage metrics show cumulative count of Article Views (full-text article views including HTML views, PDF and ePub downloads, according to the available data) and Abstracts Views on Vision4Press platform.
Data correspond to usage on the plateform after 2015. The current usage metrics is available 48-96 hours after online publication and is updated daily on week days.
Initial download of the metrics may take a while.