Fig. 3.
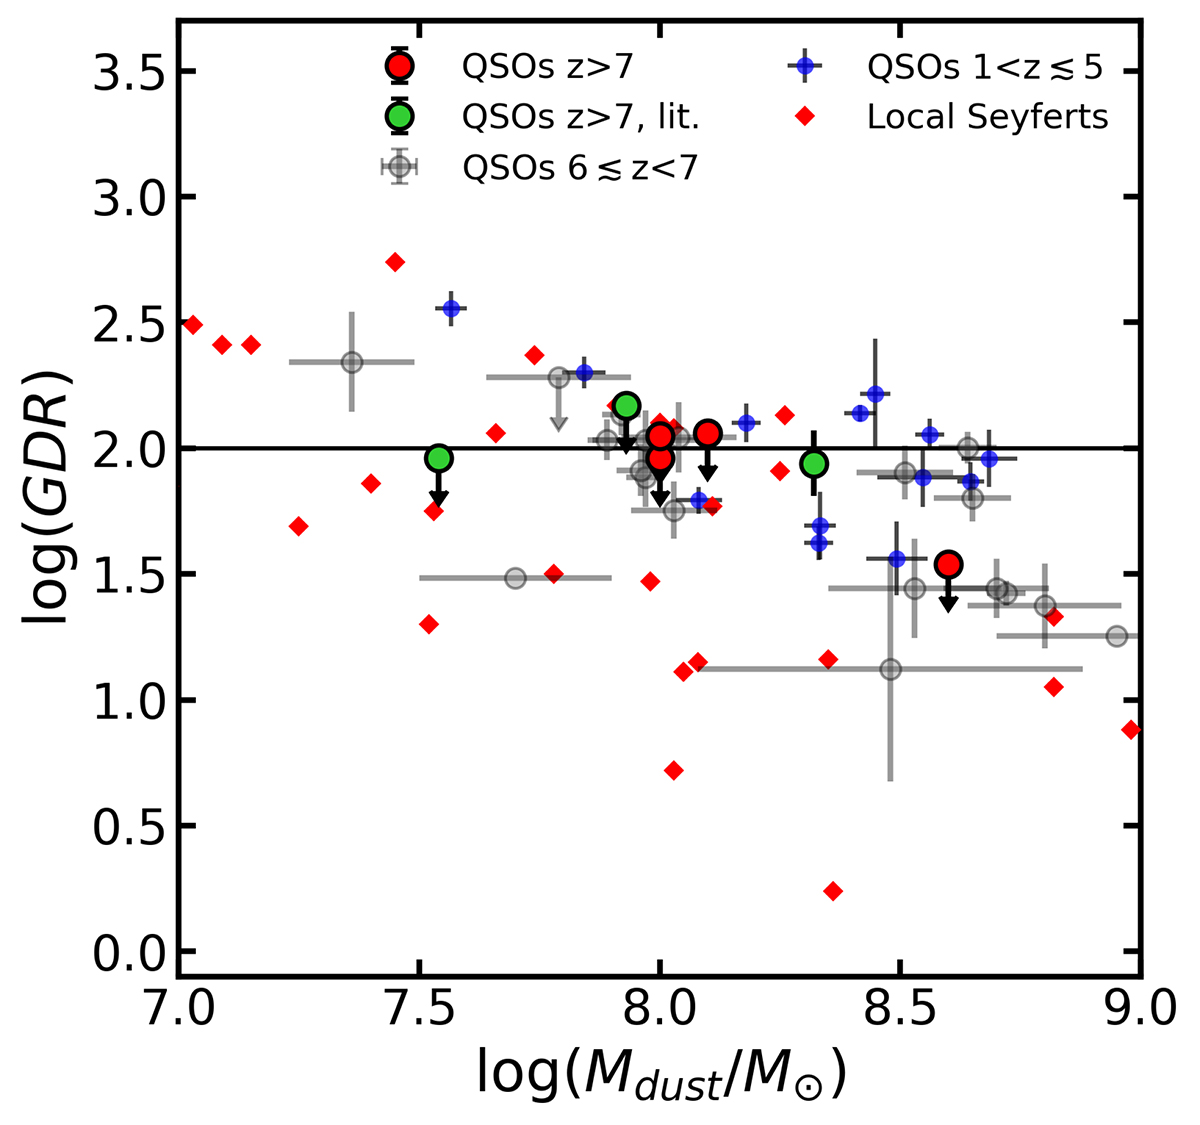
Download original image
GDR vs. dust mass. The horizontal black line represents GDR = 100. Red circles are the z > 7 quasars presented in this work with MH2 upper limits. Green circles are for J1007 from Feruglio et al. (2023), J1120 from Venemans et al. (2017a), and J1342 from Novak et al. (2019). Gray circles are the 6 ≲ z < 7 quasars from Table C.1, while blue dots are for quasars at lower redshifts from Bischetti et al. (2021), Decarli et al. (2022), and Salvestrini et al. (in prep.). Local Seyfert galaxies are shown as red diamonds.
Current usage metrics show cumulative count of Article Views (full-text article views including HTML views, PDF and ePub downloads, according to the available data) and Abstracts Views on Vision4Press platform.
Data correspond to usage on the plateform after 2015. The current usage metrics is available 48-96 hours after online publication and is updated daily on week days.
Initial download of the metrics may take a while.