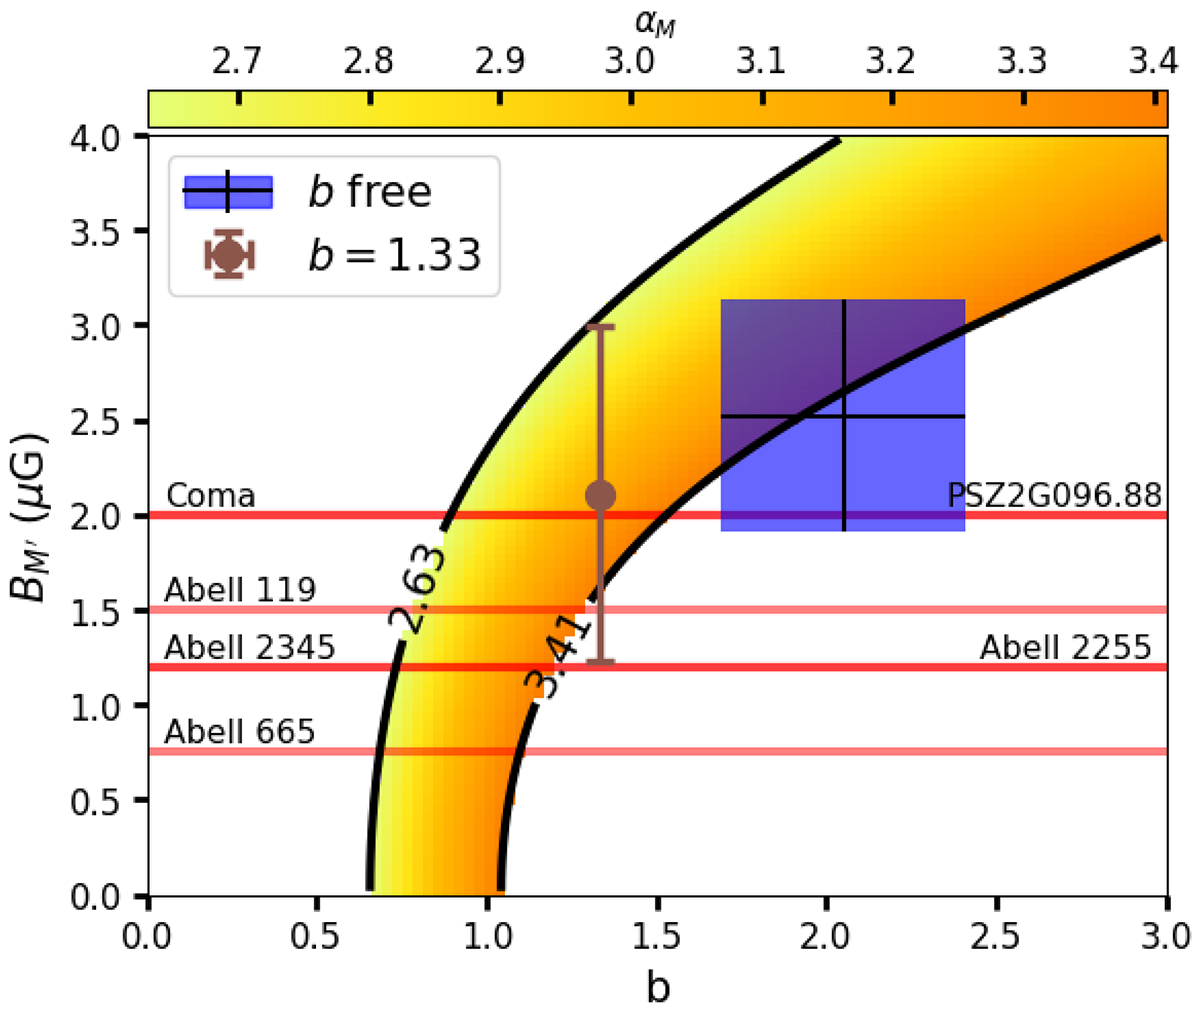
Fig. 9.
Download original image
Expected αM values as a function of BM′ (y-axis) and b (x-axis). In particular, the {BM′, b} range shown (in orange) is the one allowed by the αM slope obtained from our analysis made in Sect. 3.2 (in orange). The blue box and brown point are the best-fit values from the fit of Eq. (16). Red lines represent literature results of estimates of the average cluster magnetic field from polarisation studies (Murgia et al. 2004; Govoni et al. 2006; Guidetti et al. 2008; Bonafede et al. 2010; Vacca et al. 2010, 2012; Govoni et al. 2017; Stuardi et al. 2021; De Rubeis et al. 2024).
Current usage metrics show cumulative count of Article Views (full-text article views including HTML views, PDF and ePub downloads, according to the available data) and Abstracts Views on Vision4Press platform.
Data correspond to usage on the plateform after 2015. The current usage metrics is available 48-96 hours after online publication and is updated daily on week days.
Initial download of the metrics may take a while.