Fig. 8.
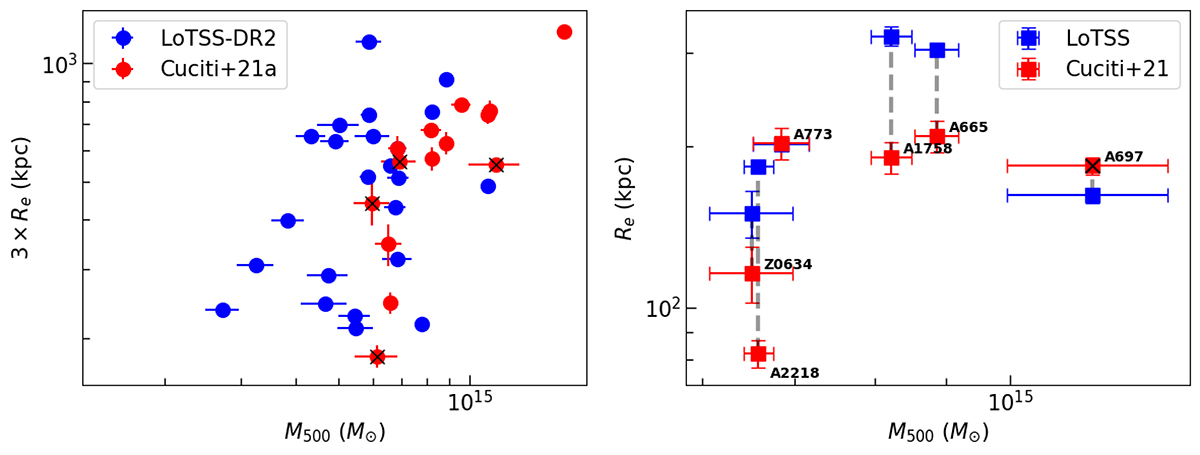
Download original image
Comparison between the results of the LoTSS DR2 and from Cuciti et al. (2021b). Left: The 3Re − M500 relation (without the low-brightness points identified in this world). Right: Comparison of the estimated Re at low and high frequencies for the common objects. Points marked with a black ‘X’ are the ones for which GMRT data, instead of VLA, have been used. For the case of A773, only the red mark is visible as the two measures overlap.
Current usage metrics show cumulative count of Article Views (full-text article views including HTML views, PDF and ePub downloads, according to the available data) and Abstracts Views on Vision4Press platform.
Data correspond to usage on the plateform after 2015. The current usage metrics is available 48-96 hours after online publication and is updated daily on week days.
Initial download of the metrics may take a while.