Fig. 1.
Download original image
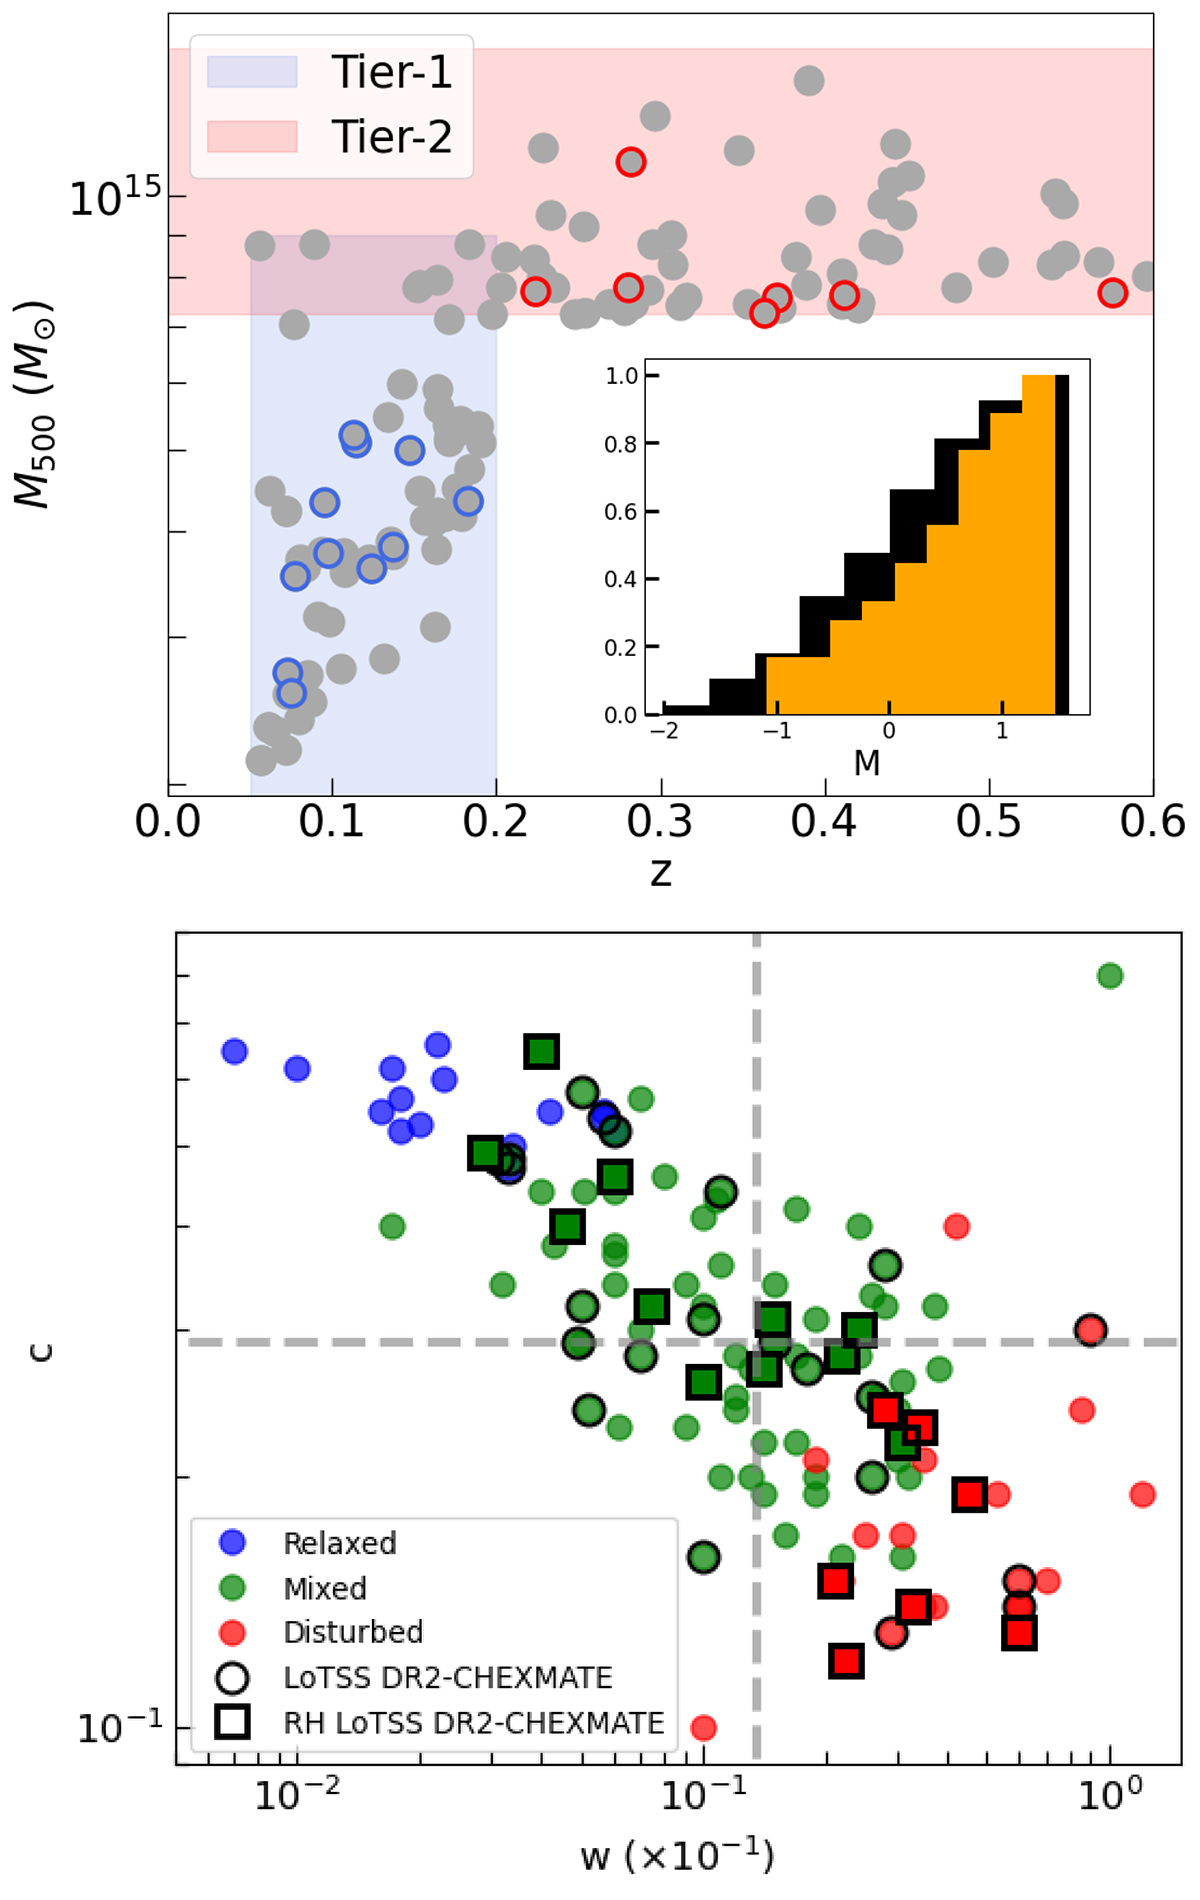
Comparison between the subsample of 18 clusters considered here and the full CHEX-MATE sample. Top: M500 − z distribution of the CHEX-MATE sample, with highlighted (circles) the LoTSS DR2 clusters with diffuse emission and the Tier-1 and Tier-2 subsamples. In the inset are reported the CDFs of the M parameter of the whole CHEX-MATE sample (black) and the one to the targets considered here (orange). Bottom: c − w plot of the whole CHEX-MATE sample, with highlighted objects with (empty black squares) and without (empty black circles) diffuse halo emission from the LoTSS DR2. The targets are coloured according to the classification made by Campitiello et al. (2022). Dashed grey lines indicate the median c and w values of the sample.
Current usage metrics show cumulative count of Article Views (full-text article views including HTML views, PDF and ePub downloads, according to the available data) and Abstracts Views on Vision4Press platform.
Data correspond to usage on the plateform after 2015. The current usage metrics is available 48-96 hours after online publication and is updated daily on week days.
Initial download of the metrics may take a while.