| Issue |
A&A
Volume 695, March 2025
|
|
|---|---|---|
| Article Number | A269 | |
| Number of page(s) | 8 | |
| Section | Extragalactic astronomy | |
| DOI | https://doi.org/10.1051/0004-6361/202453147 | |
| Published online | 25 March 2025 | |
Low-Eddington ratio, changing-look active galactic nuclei: The case of NGC 4614
1
Dipartimento di Fisica e Astronomia, Università di Firenze, via G. Sansone, 1, 50019 Sesto Fiorentino, FI, Italy
2
INAF-Osservatorio Astrofisico di Arcetri, Largo E. Fermi 5, 50125 Firenze, Italy
3
INFN, Sezione di Firenze, via G. Sansone, 1, 50019 Sesto Fiorentino, FI, Italy
4
Niels Bohr International Academy, Niels Bohr Institute, Blegdamsvej 17, DK-2100 Copenhagen Ø, Denmark
5
École Centrale de Lyon, 36 Av. Guy de Collongue, F-69130 Écully, Lyon, France
6
Department of Physics, Aristotle University of Thessaloniki, 54124 Thessaloniki, SKG, Greece
7
Fundación Galileo Galilei, Rambla José Ana Fernandez Pérez 7, 38712 Breña Baja, TF, Spain
8
INAF-Osservatorio Astrofisico di Roma, via Frascati 33, 00078 Monte Porzio Catone, RM, Italy
⋆ Corresponding author; This email address is being protected from spambots. You need JavaScript enabled to view it.
Received:
25
November
2024
Accepted:
22
February
2025
Abstract
Active galactic nuclei (AGNs) are known to be variable sources across the entire electromagnetic spectrum, in particular at optical/ultraviolet and X-ray energies. Over the past few decades, a growing number of AGNs have been observed to change type, from type 1 to type 2 or vice versa, within a few years or even months. These galaxies have been commonly referred to as changing-look AGNs (CLAGNs). Here we report on a newly discovered CLAGN, NGC 4614, which transitioned from a type 1.9 to a type 2 state. NGC 4614 is a nearly face-on barred galaxy at redshift z = 0.016 and is classified as a low-luminosity AGN. Its central black hole has a mass of about 1.6 × 10⁷ M⊙ and an Eddington ratio of around 1 percent. We recently acquired optical spectra of NGC 4614 at the Telescopio Nazionale Galileo, and the data clearly suggest that the broad Hα component has strongly dimmed, if not disappeared. A very recent Swift observation confirmed our current optical data, with the AGN weakened by almost a factor of 10 with respect to previous X-ray observations. NGC 4614 had also been observed by Swift/XRT six times in 2011, and the source was clearly detected in all those observations. By fitting the stack of the 2011 Swift observations, we obtain a photon index of Γ = 1.3 ± 0.3 and an equivalent hydrogen column density of NH = 1.2 ± 0.3 × 1022 cm−2, indicating that NGC 4614 can be moderately absorbed in X-rays. Although a significant change in the foreground gas absorption that may have obscured the broad-line region cannot be entirely ruled out, the most likely explanation is that NGC 4614 is experiencing a change in its accretion state that reduces the radiative efficiency of the X-ray corona.
Key words: galaxies: active / galaxies: nuclei / quasars: emission lines / quasars: supermassive black holes / galaxies: Seyfert / quasars: individual: NGC 4614
© The Authors 2025
 Open Access article, published by EDP Sciences, under the terms of the Creative Commons Attribution License (https://creativecommons.org/licenses/by/4.0), which permits unrestricted use, distribution, and reproduction in any medium, provided the original work is properly cited.
This article is published in open access under the Subscribe to Open model. This email address is being protected from spambots. You need JavaScript enabled to view it. to support open access publication.
1. Introduction
Active galactic nuclei (AGNs) are powered by the accretion of matter onto the supermassive black hole (SMBH; 106–1010 M⊙) located at their centre and represent a key stage of the life cycle of galaxies. This active phase is typically characterised by a (nuclear) luminosity ≳1043 erg s−1 and significant variability, mostly at X-ray energies. Depending on the presence or not of broad emission lines (with a full width at half maximum > 1000 km s−1) in their optical/UV spectra, AGNs are commonly classified into two broad categories: type 1 and type 2. Type 1 and 2 AGNs can also be interpreted as the same kind of object but surrounded by a dusty and gaseous torus that is oriented differently towards the observer, which shields the broad-line region (BLR) emission in type 2 but not in type 1 AGNs (Antonucci 1993; Netzer 2015). Whilst the fundamental parameters that determine the presence of a BLR are still uncertain, they are likely related to the SMBH accretion state and its mass (see e.g. Nicastro 2000; Elitzur & Ho 2009; Czerny & Hryniewicz 2011; Chakravorty et al. 2014). Intermediate AGN classifications (see e.g. Winkler 1992; Jana et al. 2025; Osterbrock 1977) are based on the flux ratio between broad (Hβ) and narrow ([O III] 5007Å) lines (types 1.2, 1.5, and 1.8) or on the detection of a broad Hα with missing Hβ (type 1.9). This finer classification scheme is based on the combination of the viewing angle and a clumpy distribution of the obscuring material at different optical depths; extinction and the AGN–galaxy contrast might also play a role (Goodrich 1989; Barquín-González et al. 2024). Such a classification is based on the spectral properties at optical wavelengths and is generally in good agreement with the level of obscuration determined at X-ray energies. Specifically, highly obscured (Compton-thick) AGNs are characterised by a hydrogen column density, NH, higher than 1024 cm−2, while a source is considered unobscured if NH < 1021 cm−2. In the intermediate (Compton-thin) range, the optical and X-ray classifications can significantly depart from each other (e.g. Koss et al. 2017; Shimizu et al. 2018).
In the past few decades, a number of AGNs have been shown to undergo type transitions within a few years or even months. These galaxies have been dubbed changing-look AGNs (CLAGNs). CLAGNs have been observed at X-ray energies transforming from a Compton-thick to a Compton-thin state or vice versa (e.g. Matt et al. 2003; Risaliti et al. 2005; Bianchi et al. 2009), as well as at optical wavelengths, with the broad line component of Hα and Hβ appearing in type 2 AGNs or vanishing in previously known type 1 AGNs (e.g. Denney et al. 2014; Shappee et al. 2014; Ai et al. 2020; Wang et al. 2020). In the X-ray case, the observed changes in the continuum are usually due to absorption effects, with the obscuring material located in the very inner (sub-parsec) regions (down to a few tens of gravitational radii). In the optical case, the type transition could also be related to a change in the accretion state (e.g. Jana et al. 2025). In this sense, optical CLAGNs are definitely more intriguing in the context of accretion physics.
This phenomenon is not limited to local Seyferts. The first quasar observed to transition from a type 1 to a type 1.9 (in a period of 10 years) was the X-ray-selected galaxy SDSS J015957.64+003310.5 (J0159+0033) at z = 0.31 (LaMassa et al. 2015). The changing state of this object was interpreted to be caused by a fading of the AGN continuum, which reduced the supply of ionising photons available to excite the gas in the immediate vicinity of the SMBH, rather than by variable absorption. Vanishing broad-line components have also been observed in NGC 7603 (Tohline & Osterbrock 1976), NGC 4151 (Penston & Perez 1984), NGC 1566 (Alloin et al. 1985), Mrk 372 (Gregory et al. 1991), Mrk 993 (Tran et al. 1992), and 3C 390.3 (Penston & Perez 1984; Veilleux & Zheng 1991), for instance. Broad-line components have appeared in Mrk 6 (Khachikian & Weedman 1971), Mrk 1018 (Cohen et al. 1986), NGC 1097 (Storchi-Bergmann et al. 1993), and NGC 7582 (Aretxaga et al. 1999). These variations (sometimes extremely strong; see Shappee et al. 2014 for NGC 2617) provide us with key information about the structure of the BLR (at sub-parsec scales) and the intensity (and shape) of the ionising continuum. Changes in the AGN continuum or emission line strengths, or both, could have different physical origins; for example, they can be due to the existence of an obscuring material that covers (totally or partially) the BLR (e.g. Elitzur 2012) or changes in the accretion rate (e.g. Stern et al. 2018) that can also be attributed to episodic accretion events associated with the tidal disruption of stars by the SMBH (e.g. Eracleous et al. 1995). Yet, despite the increasing number of known CLAGNs, the physical mechanism at their origin is still under debate (see Ricci & Trakhtenbrot 2023 for an extensive review).
Recently, long-slit spectroscopic data acquired by undergraduate students at the University of Florence, Italy, at the Telescopio Nazionale Galileo (TNG) with DoLoRes (Device Optimized for the LOw RESolution) in April 2019 revealed the transition of the Seyfert galaxy NGC 4156 from a type 2 (no broad-line emission) towards a (nearly) type 1. The data show a rise in the galaxy’s blue continuum as well as the appearance of a broad component of the Hα line, which were both absent in the archival 2004 spectrum from the Sloan Digital Sky Survey (SDSS). Follow-up TNG observations performed in 2022 confirmed the presence of the broad Hα line, but the blue continuum excess was no longer detected, suggesting that NGC 4156 may be transitioning back to a type 2 (Tozzi et al. 2022).
Here we report on a new CLAGN, NGC 4614, which transitioned from a type 1.9 (i.e. there is no broad Hβ line but there is a broad component of the Hα line) to a type 2 state. Similar to NGC 4156, NGC 4614 was observed during a campaign led by students at the University of Florence (see Appendix A for details). NGC 4614 is a nearly face-on barred galaxy at redshift z = 0.016 and was loosely identified as a type 1 by Oh et al. (2015) due to the presence of a broad component in the Hα emission line. The black hole mass for this low-luminosity AGN is log MBH/M⊙ ≃ 7.2 (see Oh et al. 2015 for details derived from the line width and luminosity of the broad Hα line). The bolometric luminosity is log Lbol/(erg s−1) ≃ 43.25, as computed from the relation developed by Heckman et al. (2004, Lbol ≃ 3500 L[O III]), which implies an Eddington ratio, λEdd, of 0.01 (λEdd = Lbol/LEdd, where LEdd = 1.3 × 1038 erg s−1). The spectrum of this galaxy was acquired at the TNG with DoLoRes and the low resolution grism in the blue (LR-B) on May 8, 2024, in far from optimal conditions due to the presence of clouds. Nonetheless, after reduction, the LR-B spectrum clearly suggested that the broad Hα component had dimmed significantly. We then performed higher-resolution follow-up observations of NGC 4614 at the TNG in July 2024, confirming the significant fading, and possible disappearance, of the broad Hα component (see Sect. 2.2). NGC 4614 had also been observed in X-rays by the Swift/X-ray Telescope (XRT) six times in 2011, at which time the source was clearly detected. These were the only X-ray data available for NGC 4614 until we obtained another Swift/XRT snapshot on November 1, 2024, following the discovery of the optical changes. In these data, the source was formally undetected (see Sect. 3).
We present the optical and X-ray spectroscopic data for NGC 4614 in Sects. 2 and 3. Section 4 details the spectral fitting procedure employed to compute the spectral properties from the optical spectra. We discuss the possible trigger of the changing state of the galaxy in Sect. 5. Our conclusions are outlined in Sect. 6. Throughout, we adopt a cosmology where H0 = 70 km s−1 Mpc−1, ΩM = 0.3, and ΩΛ = 0.7, giving a luminosity distance of 69.4 Mpc for NGC 4614.
2. Optical observations
2.1. TNG/LR-B data
The spectrum of NGC 4614 was acquired on May 8, 2024, with DoLoRes, which is mounted at the 3.6m TNG, using the LR-B grism (1″ slit), covering the wavelength range 3000–8400 Å. The exposure time was 900 s, the airmass of NGC 4614 at the start of the acquisition was 1 with an average seeing of 1.5″. We then reduced the LR-B TNG spectrum with the open source data reduction pipeline PYPEIT (Prochaska et al. 2020, 2022, v1.15). The data reduction followed the standard procedure, including bias subtraction and flat fielding, removal of cosmic rays, sky subtraction, extraction of the 1D spectrum, and wavelength calibration. The wavelength calibration was derived from the combined helium, neon, and mercury arc-lamps in the vacuum frame, and a quadratic polynomial function was used to fit the pixel-wavelength data. The resulting dispersion from the wavelength calibration is Δλ = 2.74 Å/px, with an average rms < 0.1 px. A standard star with known spectral type (Feige 66) was observed during the same night to account for telluric absorption and flux calibration, and its data were reduced with the aforementioned pipeline. The calibrated 1D spectrum of NGC 4614 is shown in Fig. 1, together with the 2005 SDSS spectrum and a spectrum of the same source taken in 2022 at the Cassini telescope in Loiano, Italy (see Sect. 2.3).
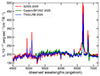 |
Fig. 1. Comparison between the archival 2005 SDSS (red curve), the 2022 Cassini/BFOSC (green curve), and the 2024 TNG/LR-B (blue curve) spectra. Fluxes and wavelengths are the observed ones (no Galactic absorption correction has been applied). The absence of the broad Hα line is apparent in both the Cassini/BFOSC and the TNG/LR-B data. |
2.2. TNG/VHR-R data
Follow-up long-slit spectroscopic observations of NGC 4614 as part of the A49DDT3 programme (PI: L. Casetti) were successfully performed at the TNG during the night of July 4, 2024, in service mode. The weather conditions during the observations were good, with clear sky and a median seeing of 0.7″. The high-resolution spectrum of the nuclear region of NGC 4614 was acquired with DoLoRes and the VHR-R grism, using a slit width of 1″, in parallactic angle with an integration time of 1800 s. The airmass of NGC 4614 at the start of the observation was 1.3, and the Moon was below the horizon throughout the observations. In addition to standard calibrations, the spectrum of the standard A0V star HD109055 was also acquired (same setup as NGC 4614 except that the integration time was 45 s to enable absolute flux calibration and telluric correction.
We reduced the VHR-R spectrum of NGC 4614 with a custom-made pipeline, using some routines from the MATLAB Astronomy and Astrophysics Toolbox (MAAT; Ofek 2014). The data reduction followed the standard procedure, including bias subtraction and flat fielding, removal of cosmic rays, sky subtraction, extraction of the one-dimensional (1D) spectrum, and wavelength calibration. The latter was derived from the Ne-Hg lamp, while a quadratic polynomial function was used to fit the pixel-wavelength data. The resulting dispersion from the wavelength calibration (whose rms error is 0.25 px) is Δλ = 0.78 Å/px. The nuclear integrated spectrum was extracted using a pseudo-slit of 1″ × 5″ centred on the galaxy centre (PA = 60°, i.e. a parallactic angle). The standard star spectrum was reduced with the same pipeline. The telluric correction and the flux calibration were performed with the IDL (Interface Definition Language) package XTELLCORR (Vacca et al. 2003).
The 6450–6900 Å region (in the observed frame) of the calibrated 1D VHR-R spectrum of NGC 4614 is shown in Fig. 2, together with the 2005 SDSS spectrum. The extraction areas of the two spectra are comparable in size (i.e. roughly 7 arcsec2 for SDSS versus 5 arcsec2 for TNG/VHR-R), but their shapes are different: the SDSS one is circular and ours is rectangular. The broad component of the Hα emission line, clearly visible in the SDSS 2005 spectrum, is apparently no longer detected in the VHR-R spectrum (see Sect. 4 for a deeper discussion), confirming what suggested by the LR-B data.
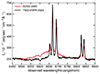 |
Fig. 2. Comparison between the archival 2005 SDSS (red curve) and 2024 TNG/VHR-R (black curve) spectra. Wavelengths are the observed ones, and the spectral region corresponds to that of the Hα/[N II] and [S II] line complexes. |
2.3. Cassini/BFOSC data
NGC 4614 had also been observed during the night of March 25, 2022, at the Cassini telescope in Loiano, Italy, again during a campaign led by undergraduate students of the University of Florence (see Appendix A for details), but the data have been reduced only in 2024, after discovering the change of state of the source. Observations were carried out with BFOSC (Bologna Faint Object Spectrograph and Camera) and grism 4, using a 2″ slit and 900 s of integration time; the sky was almost clear and the average seeing was 1.2″. The acquired data have been reduced using the same tools and procedure used for the TNG/VHR-R data (see Sect. 2.2), and the Hα/[N II] and [S II] region of the calibrated spectrum is shown in Fig. 1 together with the 2005 SDSS archival data and our 2024 TNG/LR-B spectrum. No clear broad contribution to the Hα line is visible in the Cassini/BFOSC spectrum, therefore suggesting that NGC 4614 had already changed its state in 2022.
3. X-ray observations and analysis
NGC 4614 was observed by Swift/XRT (Burrows et al. 2005) 6 times in May and July 2011, with exposure times ranging between 0.7 and 2.7 ks (total exposure 10.9 ks). The source was clearly detected in all these observations. XRT data were collected in the photon-counting mode and reduced through the SSDC (Science Space Data Center) XRT online analysis service1 (SWXRTDAS; version 3.7.0), which performs data reprocessing and exposure map generation. In all the observations, the source spectra were extracted from a circular region of 20-pixel radius located at the source position, corresponding to about 47″. The background spectra were extracted from an annular region with inner and outer radii of 40 and 80 pixels (94″ and 189″), respectively, around the source extraction area. The quality of the single observations is not sufficient to perform a detailed analysis of the individual spectra. Yet, we preliminarily fitted each dataset with a simple power-law model (subject to Galactic absorption fixed at NH, Gal = 1.16 × 1020 cm−2; HI4PI Collaboration 2016) to determine the observed X-ray luminosity and any variability. We restricted to energies from 0.5 to 8.0 keV for the spectral fitting and we adopted the Cash (1979) statistics, whereby data are binned to at least 1 count bin−1. We found an average photon index of Γ = 0.25 ± 0.11 and a 0.5–8 keV band flux log (FX, obs/erg s−1cm−2) = − 11.59 ± 0.04. Variability, a tell-tale signature of AGNs, cannot be established at more than the 1σ significance. However, despite the very unusual spectral shape, the observed X-ray luminosity is far too high (> 1042 erg s−1 at 2–10 keV) to be ascribed to the population of galactic X-ray binaries (Mineo et al. 2012) or to any ultraluminous X-ray source (Sutton et al. 2012).
The previous fit is broadly acceptable (C/ν = 272/242, where ν is the number of degrees of freedom), but is still not optimal. To gain more insight into the actual spectral shape of NGC 4614, we stacked the six Swift spectra to improve the signal-to-noise ratio. With about 280 cumulative net counts in the 0.5–8 keV band, we grouped the resulting spectrum to a significance of 5σ per energy bin to allow the use of the standard χ2 minimisation in the fit. A power-law continuum modified by Galactic absorption only does not provide an adequate description of the stacked spectrum, with χ2/ν = 31/9 for Γ ≃ 0.2 and a corresponding null-hypothesis probability of 2.5 × 10⁻⁴. The inclusion of an additional absorber in the local frame of NGC 4614 dramatically improves the fit down to χ2/ν = 5/8, returning a photon index of Γ = 1.3 ± 0.3 and an equivalent hydrogen column density of NH = (1.2 ± 0.3) × 1022 cm−2. The stacked 2011 Swift spectrum and its best fit are shown in Fig. 3, while the confidence contours for the two parameters of interest in this model are shown in Fig. 4. The continuum slope is still somewhat flat, yet fixing it to the more canonical value of 1.8 still leads to a fully acceptable fit (χ2/ν = 8/9) with an increase in the absorbing column of ∼50 percent. Since the implied X-ray obscuration is moderate, the exact values of Γ and NH have a marginal effect on the estimated intrinsic 2–10 keV flux and luminosity, which are (2.7 ± 0.3) × 10−12 erg s−1 cm−2 and (1.55 ± 0.15) × 1042 erg s−1, respectively, from the nominal best fit.
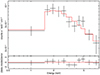 |
Fig. 3. Stacked 2011 Swift spectrum and its best fit (solid red line), consisting of an absorbed power law. The data points are binned to a 5σ significance per energy bin. See Sect. 3 for details. |
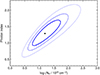 |
Fig. 4. Statistical contours at the 68, 90, and 99 percent level for the photon index and the equivalent hydrogen column density resulting from the fit of the stack of the 2011 Swift/XRT spectra, where the model leaves Γ and NH free to vary (see Sect. 3). |
We followed up the galaxy with Swift as a target of opportunity (programme ID=16856, PI: E. Lusso) on November 1, 2024, for 1597 s, and the galaxy is formally not detected (significance < 2σ at 0.5–8 keV). We derived a 95 percent upper limit on the source counts in a 47″ (20-pixel) aperture circle of ≲10 counts. This corresponds to a 2–10 keV flux of 4.5 × 10⁻¹³ erg s−1 cm−2, which is at least six times lower than the average of 2011 assuming the same spectral shape. This observation is in agreement with the optical spectra that do not show any sign of nuclear emission from the AGN. Since there are no other deeper X-ray data for this galaxy, we could not further test whether absorption or variability are present. However, we note that, for such a flux drop to be entirely due to a change in the X-ray obscuration, the column density should have increased by at least a factor of ∼50.
Interestingly, an extended source detected in the first six months of the eROSITA (extended ROentgen Survey with an Imaging Telescope Array) sky scan (eRASS1; from December 11, 2019, to June 11, 2020; Merloni et al. 2024), namely 1eRASS J124130.8+260242, is marginally consistent2 with the coordinates of NGC 4614. The 0.2–2.3 keV flux of this extended source is 1.5 × 10⁻¹³ erg s−1 cm−2, which is smaller by a factor of 1.7 than the observed flux of NGC 4614 in the same band as derived from the 2011 Swift stack. While the association with NGC 4614 is dubious, the eROSITA detection can serve as a conservative upper limit. Moreover, it implies that NGC 4614 itself would have been readily detected in eRASS1 as a point-like source, were it found in the same X-ray state of 2011. This is a further suggestion that the AGN is possibly in a prolonged low state (see Sect. 2.3).
4. Optical spectral analysis
We fitted the three 1D spectra of NGC 4614 (i.e. the SDSS 2005, the TNG/LR-B 2024, and the VHR-R 2024) with the fitting code QSFIT (Calderone et al. 2017). Specifically, the SDSS and the LR-B spectra were fitted, assuming Gaussian line profiles, over the 3800–7000 Å wavelength range, while the VHR-R one over the 6200–7800 Å range.
We first fitted the SDSS spectrum, finding that a 13 Gyr old elliptical (Silva et al. 1998) provides the best representation of the host galaxy continuum (mostly dominated by the bulge) for NGC 4614, which we then fixed to fit the LR-B and VHR-R data. The [O III] 5007Å emission line luminosity measured from the SDSS data is fully consistent with the value reported by Oh et al. (2013; i.e. 5 × 1039 erg s−1). Given the lower spectral resolution of the LR-B data, the fit of the LR-B spectrum provides slightly higher but consistent emission line luminosity (≃8 × 1039 erg s−1). This value is also in excellent agreement with the [O III] versus 2–10 keV correlation (e.g. Ueda et al. 2015), assuming the 2011 X-ray flux state. From Eq. (1) in Zhang (2022), we can estimate the narrow-line region size from the [O III] line luminosity to be about 1500 pc, consistent with what is found in low-redshift AGNs. The light crossing time of a region of this size is a few thousand years, and thus no variation in the [O III] emission line is expected on the timescales of our observations.
The best-fit parameters for the line luminosity, full width at half maximum (FWHM), and equivalent width (EW) of the broad component detected in the SDSS spectrum are (5.74 ± 0.06)×1040 erg s−1, 6160 ± 70 km s−1, and 50.7 ± 0.5 Å, whilst the ones for the narrow component are (1.30 ± 0.02)×1040 erg s−1, 300 ± 5 km s−1, and 11.4 ± 0.2 Å, respectively. We then tested whether the presence of a broad Hα component can be detected in the LR-B and VHR-R data. By fitting the VHR-R spectrum, we find that a broad component is barely detected, with the best-fit line luminosity, FWHM, and EW of ∼1 × 1040 erg s−1, ∼ 1500 km s−1, and ∼10 Å, respectively; conversely the values of the spectral parameters for the narrow component are fully consistent with the ones computed from the SDSS spectrum. The VHR-R spectrum and the best-fit model are shown in Fig. 5. The broad component cannot be constrained from the LR-B spectrum. Moreover, the broad Hα is no longer statistically significant in the VHR-R spectrum if a Lorentzian profile is considered instead of a Gaussian, implying that the strength of this feature in 2024 is indeed very low and that the value given above for the luminosity of the broad Hα line can thus be considered as an upper limit. A summary of the emission line properties is given in Table 1.
Integrated luminosities and EWs resulting from the fit for the main emission lines.
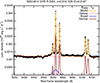 |
Fig. 5. Comparison between the VHR-R spectrum and the overall model. The individual components are shown in the legend. |
5. Changing accretion state or variable absorption?
Elitzur & Ho (2009) noticed that the disc-wind scenario in AGNs implies the disappearance of both the BLR and the near-infrared emission from the toroidal obscuration region at luminosities lower than 5 × 1039 (MBH/107 M⊙)2/3 erg s−1. The predicted radiative efficiency of accretion onto the SMBH should be lower than 10−3 for these sources, indicating that their accretion is advection-dominated (Ho 2009). It is unclear whether this scenario can be a viable explanation for the dimming of the broad Hα line in NGC 4614, as there is no near- to mid-infrared spectroscopy available that covers the range where we expect the nuclear reprocessed emission from dust to be significant (at wavelengths longer than 2 μm). The nuclear continuum is also undetected in all the optical spectra, so it is unknown by how much the accretion rate might have changed. The nuclear emission of NGC 4614 is detected at X-ray energies only in 2011, so the AGN should have been active during that period, but there is no coeval optical spectroscopy available to constrain any possible variation on the continuum radiation.
If the change in the broad line component of the Hα is connected to a drop in the nuclear luminosity, and thus in the accretion rate, the Eddington ratio should have dropped to values lower than that observed in 2005 (i.e. λEdd ≃ 0.01). The source is undetected in the latest 2024 Swift X-ray observation, yet we can estimate its actual 2–10 keV luminosity to be ≈1.5 × 1041 erg s−1, which is roughly 15 times that of the 2024/VHR-R broad Hα line from Ho et al. (2001, see their Fig. 2). This is consistent with the inferred upper limit and with the drop of almost one order of magnitude of the X-ray luminosity. Assuming a bolometric correction of 10–15 (Lusso et al. 2012, see also Duras et al. 2020), this suggests a current Eddington ratio of ≈10−3.
The value of λEdd of 1 percent is expected for the accretion disc to transition between a radiatively inefficient accretion flow and a thin accretion disc (e.g. Narayan & Yi 1995), thus suggesting that the low-luminosity (low-Eddington) AGN in NGC 4614 could be operating around the threshold mass accretion rate between these two accretion modes. This behaviour is consistent with NGC 4156 and several other local AGNs, such as NGC 3516 (Collin-Souffrin et al. 1973), NGC 7603 (e.g. Tohline & Osterbrock 1976; Kollatschny et al. 2000), Mrk 590 (Denney et al. 2014), HE 1136−2304 (Parker et al. 2016; Zetzl et al. 2018; Kollatschny et al. 2018), NGC 2992 (Guolo et al. 2021), and IRAS 23226−3843 (Kollatschny et al. 2020). It has been suggested that all CLAGNs could be associated with an accretion state transition at λEdd around 1 percent, similar to what is seen in X-ray binaries (e.g. Noda & Done 2018; MacLeod et al. 2019; Hagen et al. 2024), and our recent X-ray observation from Swift supports a scenario where the activity of the central AGN has significantly dropped since 2011. At relatively low accretion rates, the accretion flow is more likely to experience instabilities that drive changes in the optical flux by a factor of a few on multi-year timescales, as also suggested by the most rapidly variable quasars from the SDSS (e.g. Rumbaugh et al. 2018; see also Jana et al. 2025 for recent results from the BAT AGN spectroscopic survey).
At present, however, we cannot completely rule out that the observed behaviour is due to obscuration effects. Following LaMassa et al. (2015), we can estimate the crossing time for an intervening object outside the BLR on a Keplerian orbit to be
![Mathematical equation: $$ \begin{aligned} t_{\rm cross} = 0.07 \left[ \frac{r_{\rm orb}}{1 \mathrm {lt-day}}\right]^{3/2} M_8^{-1/2} \arcsin \left[ \frac{R_{\rm BLR}}{r_{\rm orb}}\right]\, \mathrm{years}, \end{aligned} $$](/articles/aa/full_html/2025/03/aa53147-24/aa53147-24-eq9.gif) (1)
(1)
where rorb is the orbital radius of the foreground object, and M8 is the black hole mass in units of 108 M⊙. The size of the BLR (RBLR) in NGC 4614 relative to the broad Hα component, as determined from the SDSS data, is computed from Eq. (2) in Dalla Bontà et al. (2025, with parameters given in the second line of their Table 3) and is 3.7 days (i.e. 0.003 parsecs). If we assume that the intervening object is located at 5 times RBLR, tcross is about 3 years. This value increases to ≃13 years in the case we assume rorb = 100 RBLR. From these timescales, we cannot fully exclude variable absorption to be the cause of the spectral change in NGC 4614 in the time-frame spanned by the data where the Hα is not detected (since 2022). A reappearance of the broad Hα component in the next few years might be expected in this ‘eclipsing’ scenario.
6. Conclusions
Over the past few decades, a growing number of AGNs have been observed to undergo sometimes dramatic type transitions (or transitions between subtypes) within a few years or even months. These galaxies, commonly known as CLAGNs, are of paramount importance since they could provide key insights into the accretion physics onto the SMBH. It has been suggested that many CLAGNs show spectral variations when they cross the state transition boundary at an λEdd of about one to a few percent.
We have reported new observations of NGC 4614, a low-luminosity AGN (Oh et al. 2015) that transitioned from a type 1.9 to a type 2 state. We observed NGC 4614 spectroscopically at the TNG in the optical, and the data clearly suggest that the broad Hα component has at least strongly dimmed, and perhaps disappeared, with respect to archival data taken two decades ago. We have also presented a spectrum of the same source taken at the Cassini telescope in Loiano in 2022, where no broad component of the Hα line can be detected either, thus suggesting that the transition had already occurred by 2022. A very recent Swift observation is in full agreement with our current optical data, with the AGN weakened by almost a factor of 10 with respect to previous X-ray observations. NGC 4614 was observed by Swift/XRT six times in 2011 and the source was clearly detected, indicating NGC 4614 is an active AGN. The best fit of the stacked Swift data returned a continuum photon index of Γ = 1.3 ± 0.3 and a column density of NH = (1.2 ± 0.3) × 1022 cm−2, corresponding to an intrinsic 2–10 keV luminosity of 1.55 × 1042 erg s−1. The suggested X-ray absorption must be strongly variable (by a factor of at least ∼50) to fully account for the recent X-ray drop. If the obscurer were located beyond the BLR, this absorption could possibly also be associated with the disappearance of the broad Hα line. However, such a scenario would require a substantial degree of geometrical fine-tuning, especially considering that NGC 4614 is a nearly face-on system. The most likely explanation for our optical and X-ray data is therefore that NGC 4614 has experienced a change in accretion state (e.g. Noda & Done 2018), which likely occurred before 2022 (the Loiano spectrum confirms that the broad Hα line was already missing in 2022), and possibly before 2020, when eROSITA visited the source and found it in a low X-ray state compatible with the current one.
This study demonstrates that having complementary X-ray observations during the epoch of the optical/BLR change in appearance is fundamental to making further progress in understanding the origin of these phenomena. X-rays are the only probe of the properties of the inner accretion flow. So far, no univocal picture has emerged; this would require more X-ray coverage of optical changing-look events. NGC 4614 is one of the few sources for which X-ray and optical data are almost simultaneous, suggesting the black hole is in an inactive phase. Further spectroscopic observations, ideally simultaneous, at optical and X-ray energies would be key to better constraining the duty cycle of this galaxy. New optical spectroscopic observations are already planned for the near future.
The estimated source extent is 9.8″ ± 5.7″, while the distance from NGC 4614 is about 12″.
Acknowledgments
We thank the anonymous reviewer for their thorough reading and for useful comments that have improved the clarity of the paper. Based on observations made with the Italian Telescopio Nazionale Galileo (TNG) operated by the Fundación Galileo Galilei (FGG) of the Istituto Nazionale di Astrofisica (INAF) at the Observatorio del Roque de los Muchachos (La Palma, Canary Islands, Spain) and with the G. D. Cassini telescope operated by INAF-Osservatorio di Astrofisica e Scienza dello Spazio di Bologna at the Osservatorio di Loiano, Italy. We are grateful to the Swift team for approving the DDT observation of NGC 4614. We acknowledge the use of public data from the Swift data archive. This research has made use of the XRT Data Analysis Software (XRTDAS) developed under the responsibility of the ASI Science Data Center (ASDC), Italy, and of the NASA/IPAC Extragalactic Database (NED) which is operated by the Jet Propulsion Laboratory, Caltech, under contract with the National Aeronautics and Space Administration. This work was performed in part at the Aspen Center for Physics, which is supported by National Science Foundation grant PHY-2210452. EL and EN acknowledge partial support from the Simons Foundation (1161654, Troyer). We thank the TNG Director A. Ghedina for Director Discretionary Time allowing us to perform the 2024 follow-up higher-resolution observations, for which we also thank W. Boschin as support astronomer. We thank I. Bruni for the support during the 2022 Cassini observations. The participation of the students to the 2024 TNG observing campaign was financially supported by INAF-Osservatorio Astrofisico di Arcetri and by the Dipartimento di Fisica e Astronomia, Università di Firenze. We thank again the TNG Director and the whole TNG staff for making such an experience possible.
References
- Ai, Y., Dou, L., Yang, C., et al. 2020, ApJ, 890, L29 [NASA ADS] [CrossRef] [Google Scholar]
- Alloin, D., Pelat, D., Phillips, M., & Whittle, M. 1985, ApJ, 288, 205 [NASA ADS] [CrossRef] [Google Scholar]
- Antonucci, R. 1993, ARA&A, 31, 473 [Google Scholar]
- Aretxaga, I., Joguet, B., Kunth, D., Melnick, J., & Terlevich, R. J. 1999, ApJ, 519, L123 [NASA ADS] [CrossRef] [Google Scholar]
- Barquín-González, L., Mateos, S., Carrera, F. J., et al. 2024, A&A, 687, A159 [NASA ADS] [CrossRef] [EDP Sciences] [Google Scholar]
- Bianchi, S., Piconcelli, E., Chiaberge, M., et al. 2009, ApJ, 695, 781 [Google Scholar]
- Burrows, D. N., Hill, J. E., Nousek, J. A., et al. 2005, Space Sci. Rev., 120, 165 [Google Scholar]
- Calderone, G., Nicastro, L., Ghisellini, G., et al. 2017, MNRAS, 472, 4051 [Google Scholar]
- Cash, W. 1979, ApJ, 228, 939 [Google Scholar]
- Chakravorty, S., Elvis, M., & Ferland, G. 2014, MNRAS, 437, 740 [CrossRef] [Google Scholar]
- Cohen, R. D., Rudy, R. J., Puetter, R. C., Ake, T. B., & Foltz, C. B. 1986, ApJ, 311, 135 [NASA ADS] [CrossRef] [Google Scholar]
- Collin-Souffrin, S., Alloin, D., & Andrillat, Y. 1973, A&A, 22, 343 [NASA ADS] [Google Scholar]
- Czerny, B., & Hryniewicz, K. 2011, A&A, 525, L8 [NASA ADS] [CrossRef] [EDP Sciences] [Google Scholar]
- Dalla Bontà, E., Peterson, B. M., Grier, C. J., et al. 2025, A&A, in press, https://doi.org/10.1051/0004-6361/202452746 [Google Scholar]
- Denney, K. D., De Rosa, G., Croxall, K., et al. 2014, ApJ, 796, 134 [Google Scholar]
- Duras, F., Bongiorno, A., Ricci, F., et al. 2020, A&A, 636, A73 [NASA ADS] [CrossRef] [EDP Sciences] [Google Scholar]
- Elitzur, M. 2012, ApJ, 747, L33 [Google Scholar]
- Elitzur, M., & Ho, L. C. 2009, ApJ, 701, L91 [Google Scholar]
- Eracleous, M., Livio, M., & Binette, L. 1995, ApJ, 445, L1 [Google Scholar]
- Goodrich, R. W. 1989, ApJ, 340, 190 [NASA ADS] [CrossRef] [Google Scholar]
- Gregory, S. A., Tifft, W. G., & Cocke, W. J. 1991, AJ, 102, 1977 [Google Scholar]
- Guolo, M., Ruschel-Dutra, D., Grupe, D., et al. 2021, MNRAS, 508, 144 [NASA ADS] [CrossRef] [Google Scholar]
- Hagen, S., Done, C., Silverman, J. D., et al. 2024, MNRAS, 534, 2803 [NASA ADS] [CrossRef] [Google Scholar]
- Heckman, T. M., Kauffmann, G., Brinchmann, J., et al. 2004, ApJ, 613, 109 [Google Scholar]
- HI4PI Collaboration (Ben Bekhti, N., et al.) 2016, A&A, 594, A116 [NASA ADS] [CrossRef] [EDP Sciences] [Google Scholar]
- Ho, L. C. 2009, ApJ, 699, 626 [NASA ADS] [CrossRef] [Google Scholar]
- Ho, L. C., Feigelson, E. D., Townsley, L. K., et al. 2001, ApJ, 549, L51 [NASA ADS] [CrossRef] [Google Scholar]
- Jana, A., Ricci, C., Temple, M. J., et al. 2025, A&A, 693, A35 [NASA ADS] [CrossRef] [EDP Sciences] [Google Scholar]
- Khachikian, E. Y., & Weedman, D. W. 1971, ApJ, 164, L109 [NASA ADS] [CrossRef] [Google Scholar]
- Kollatschny, W., Bischoff, K., & Dietrich, M. 2000, A&A, 361, 901 [NASA ADS] [Google Scholar]
- Kollatschny, W., Ochmann, M. W., Zetzl, M., et al. 2018, A&A, 619, A168 [NASA ADS] [CrossRef] [EDP Sciences] [Google Scholar]
- Kollatschny, W., Grupe, D., Parker, M. L., et al. 2020, A&A, 638, A91 [NASA ADS] [CrossRef] [EDP Sciences] [Google Scholar]
- Koss, M., Trakhtenbrot, B., Ricci, C., et al. 2017, ApJ, 850, 74 [Google Scholar]
- LaMassa, S. M., Cales, S., Moran, E. C., et al. 2015, ApJ, 800, 144 [NASA ADS] [CrossRef] [Google Scholar]
- Lusso, E., Comastri, A., Simmons, B. D., et al. 2012, MNRAS, 425, 623 [Google Scholar]
- Lusso, E., Casetti, L., Pancrazzi, M., & Romoli, M. 2022, arXiv e-prints [arXiv:2210.13360] [Google Scholar]
- MacLeod, C. L., Green, P. J., Anderson, S. F., et al. 2019, ApJ, 874, 8 [Google Scholar]
- Matt, G., Guainazzi, M., & Maiolino, R. 2003, MNRAS, 342, 422 [NASA ADS] [CrossRef] [Google Scholar]
- Merloni, A., Lamer, G., Liu, T., et al. 2024, A&A, 682, A34 [NASA ADS] [CrossRef] [EDP Sciences] [Google Scholar]
- Mineo, S., Gilfanov, M., & Sunyaev, R. 2012, MNRAS, 419, 2095 [Google Scholar]
- Narayan, R., & Yi, I. 1995, ApJ, 452, 710 [NASA ADS] [CrossRef] [Google Scholar]
- Netzer, H. 2015, ARA&A, 53, 365 [Google Scholar]
- Nicastro, F. 2000, ApJ, 530, L65 [NASA ADS] [CrossRef] [Google Scholar]
- Noda, H., & Done, C. 2018, MNRAS, 480, 3898 [Google Scholar]
- Ofek, E. O. 2014, MAAT: MATLAB Astronomy and Astrophysics Toolbox, Astrophysics Source Code Library [record ascl:1407.005] [Google Scholar]
- Oh, S., Woo, J.-H., Bennert, V. N., et al. 2013, ApJ, 767, 117 [Google Scholar]
- Oh, K., Yi, S. K., Schawinski, K., et al. 2015, ApJS, 219, 1 [Google Scholar]
- Osterbrock, D. E. 1977, ApJ, 215, 733 [Google Scholar]
- Parker, M. L., Komossa, S., Kollatschny, W., et al. 2016, MNRAS, 461, 1927 [NASA ADS] [CrossRef] [Google Scholar]
- Penston, M. V., & Perez, E. 1984, MNRAS, 211, 33P [NASA ADS] [CrossRef] [Google Scholar]
- Prochaska, J., Hennawi, J., Westfall, K., et al. 2020, J. Open Source Software, 5, 2308 [NASA ADS] [CrossRef] [Google Scholar]
- Prochaska, J. X., Hennawi, J., Cooke, R., et al. 2022, https://doi.org/10.5281/zenodo.3506872 [Google Scholar]
- Ricci, C., & Trakhtenbrot, B. 2023, Nat. Astron., 7, 1282 [Google Scholar]
- Risaliti, G., Elvis, M., Fabbiano, G., Baldi, A., & Zezas, A. 2005, ApJ, 623, L93 [Google Scholar]
- Rumbaugh, N., Shen, Y., Morganson, E., et al. 2018, ApJ, 854, 160 [NASA ADS] [CrossRef] [Google Scholar]
- Shappee, B. J., Prieto, J. L., Grupe, D., et al. 2014, ApJ, 788, 48 [Google Scholar]
- Shimizu, T. T., Davies, R. I., Koss, M., et al. 2018, ApJ, 856, 154 [NASA ADS] [CrossRef] [Google Scholar]
- Silva, L., Granato, G. L., Bressan, A., & Danese, L. 1998, ApJ, 509, 103 [Google Scholar]
- Stern, D., McKernan, B., Graham, M. J., et al. 2018, ApJ, 864, 27 [Google Scholar]
- Storchi-Bergmann, T., Baldwin, J. A., & Wilson, A. S. 1993, ApJ, 410, L11 [NASA ADS] [CrossRef] [Google Scholar]
- Sutton, A. D., Roberts, T. P., Walton, D. J., Gladstone, J. C., & Scott, A. E. 2012, MNRAS, 423, 1154 [NASA ADS] [CrossRef] [Google Scholar]
- Tohline, J. E., & Osterbrock, D. E. 1976, ApJ, 210, L117 [Google Scholar]
- Tozzi, G., Lusso, E., Casetti, L., et al. 2022, A&A, 667, L12 [NASA ADS] [CrossRef] [EDP Sciences] [Google Scholar]
- Tran, H. D., Osterbrock, D. E., & Martel, A. 1992, AJ, 104, 2072 [NASA ADS] [CrossRef] [Google Scholar]
- Ueda, Y., Hashimoto, Y., Ichikawa, K., et al. 2015, ApJ, 815, 1 [NASA ADS] [CrossRef] [Google Scholar]
- Vacca, W. D., Cushing, M. C., & Rayner, J. T. 2003, PASP, 115, 389 [NASA ADS] [CrossRef] [Google Scholar]
- Veilleux, S., & Zheng, W. 1991, ApJ, 377, 89 [NASA ADS] [CrossRef] [Google Scholar]
- Wang, J., Xu, D. W., & Wei, J. Y. 2020, ApJ, 901, 1 [Google Scholar]
- Winkler, H. 1992, MNRAS, 257, 677 [NASA ADS] [Google Scholar]
- Zetzl, M., Kollatschny, W., Ochmann, M. W., et al. 2018, A&A, 618, A83 [NASA ADS] [CrossRef] [EDP Sciences] [Google Scholar]
- Zhang, X. 2022, ApJS, 260, 31 [NASA ADS] [CrossRef] [Google Scholar]
Appendix A: Student observing campaign
The observations of NGC 4614 carried out at the Cassini telescope in Loiano on March 25, 2022, and at the TNG on May 8, 2024, were part of a multi-year campaign planned and performed by undergraduate students of the Physics and Astronomy Department of the University of Florence (Italy), as part of a course on introductory observational astrophysics (Lusso et al. 2022).
This programme targets active and non-active spiral galaxies to perform both imaging and low-to-medium resolution spectroscopic observations with the main scientific aim of measuring the apparent diameter (from imaging) and redshift (from spectroscopy) of these sources to constrain the expansion rate of the universe, parameterised by the Hubble parameter, H0. Ancillary science goals are the determination of the star formation rate and the estimate of the mass of the central SMBH whenever the observed galaxy has an active nucleus. Therefore, any CLAGN observed within this programme is a serendipitous discovery, as no previously known CLAGN has been explicitly targeted. We also note that the discovery of NGC 4156 as a CLAGN (Tozzi et al. 2022) was based on observations carried out in 2019 at the TNG by undergraduate students attending the same course.
The programme started in 2010. To date, 93 bright nearby (z < 0.15) spiral galaxies have been observed using various facilities: 74 at the 1.5m Cassini telescope in Loiano (operated by INAF Bologna, Italy), 4 at the 1.8m Copernico telescope in Asiago-Ekar (INAF Padova, Italy), and 15 at the 3.6m TNG telescope. Each year, data from the observations are reduced by the students as part of their laboratory activity. However, typically not all the sources are reduced soon after the observations. In particular, the 2022 data of NGC 4614 taken at Loiano have been reduced only in 2024, after TNG data for the same source hinted at the disappearance of the broad component of the Hα line.
All Tables
Integrated luminosities and EWs resulting from the fit for the main emission lines.
All Figures
|
Fig. 1. Comparison between the archival 2005 SDSS (red curve), the 2022 Cassini/BFOSC (green curve), and the 2024 TNG/LR-B (blue curve) spectra. Fluxes and wavelengths are the observed ones (no Galactic absorption correction has been applied). The absence of the broad Hα line is apparent in both the Cassini/BFOSC and the TNG/LR-B data. |
| In the text | |
|
Fig. 2. Comparison between the archival 2005 SDSS (red curve) and 2024 TNG/VHR-R (black curve) spectra. Wavelengths are the observed ones, and the spectral region corresponds to that of the Hα/[N II] and [S II] line complexes. |
| In the text | |
|
Fig. 3. Stacked 2011 Swift spectrum and its best fit (solid red line), consisting of an absorbed power law. The data points are binned to a 5σ significance per energy bin. See Sect. 3 for details. |
| In the text | |
|
Fig. 4. Statistical contours at the 68, 90, and 99 percent level for the photon index and the equivalent hydrogen column density resulting from the fit of the stack of the 2011 Swift/XRT spectra, where the model leaves Γ and NH free to vary (see Sect. 3). |
| In the text | |
|
Fig. 5. Comparison between the VHR-R spectrum and the overall model. The individual components are shown in the legend. |
| In the text | |
Current usage metrics show cumulative count of Article Views (full-text article views including HTML views, PDF and ePub downloads, according to the available data) and Abstracts Views on Vision4Press platform.
Data correspond to usage on the plateform after 2015. The current usage metrics is available 48-96 hours after online publication and is updated daily on week days.
Initial download of the metrics may take a while.