Fig. 4.
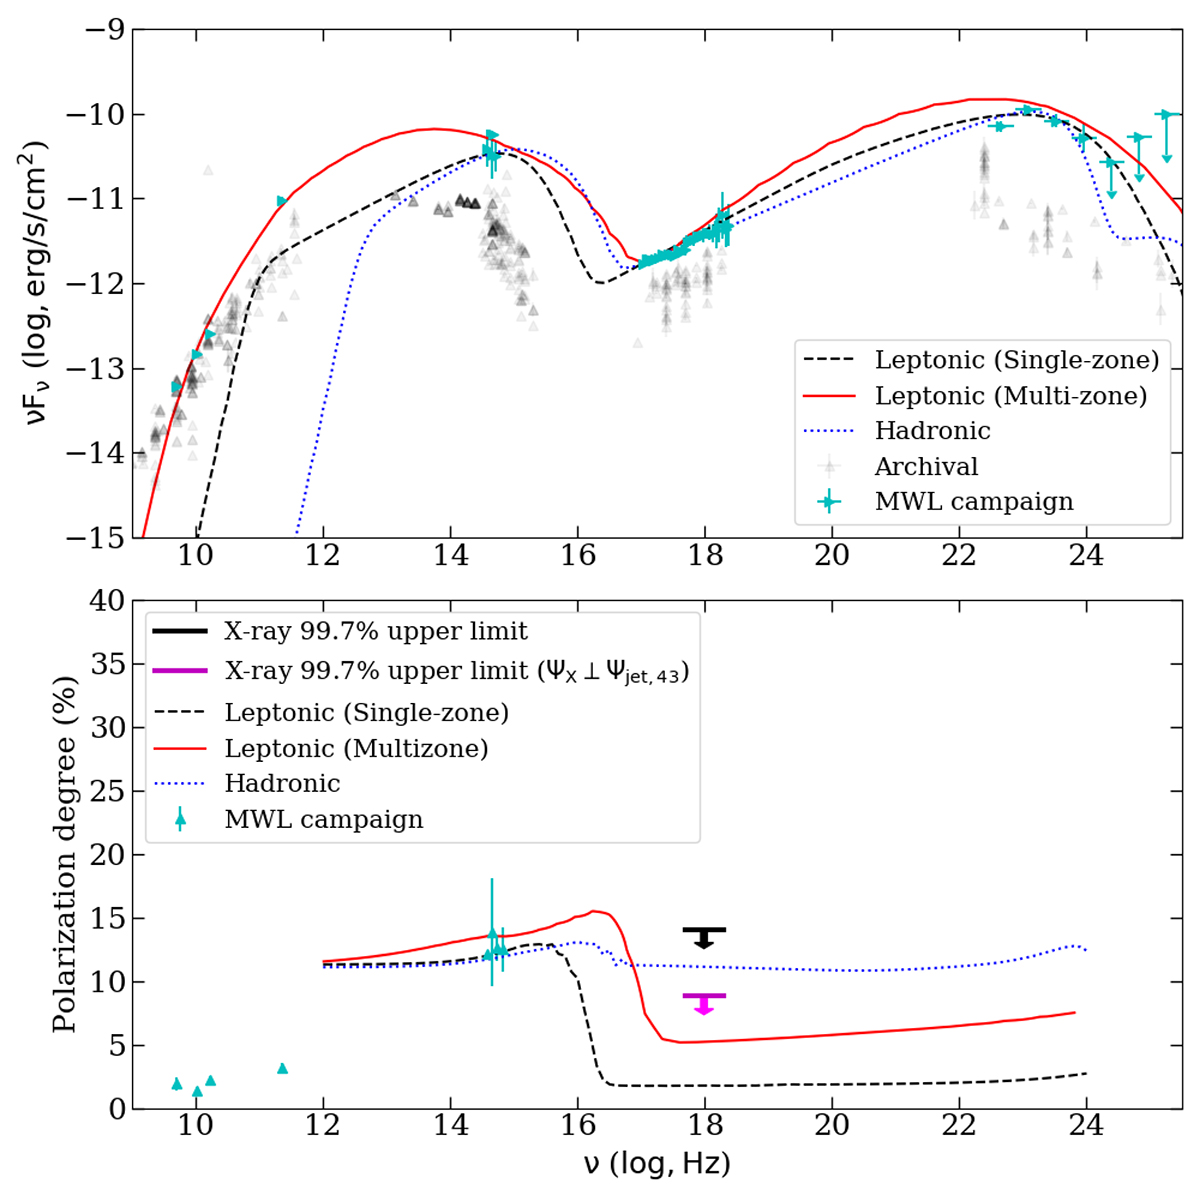
Download original image
Top: Spectral energy distribution (SED) of S4 0954+65. Bottom: Spectral polarization distribution (SPD) of S4 0954+65. In both panels, the cyan data points show the median and standard deviation values at different frequencies during the IXPE exposure. The archival observations (non-simultaneous) are shown in black for reference. The different models are represented by the solid, dashed, and dotted colored lines, as indicated in the legend. In the bottom panel the black downward arrow indicates the 3σ upper limit for the entire exposure, and the magenta arrow the 3σ upper limit under the assumption that the X-ray polarization angle is aligned perpendicular to the 43 GHz jet position angle (see Table 1).
Current usage metrics show cumulative count of Article Views (full-text article views including HTML views, PDF and ePub downloads, according to the available data) and Abstracts Views on Vision4Press platform.
Data correspond to usage on the plateform after 2015. The current usage metrics is available 48-96 hours after online publication and is updated daily on week days.
Initial download of the metrics may take a while.