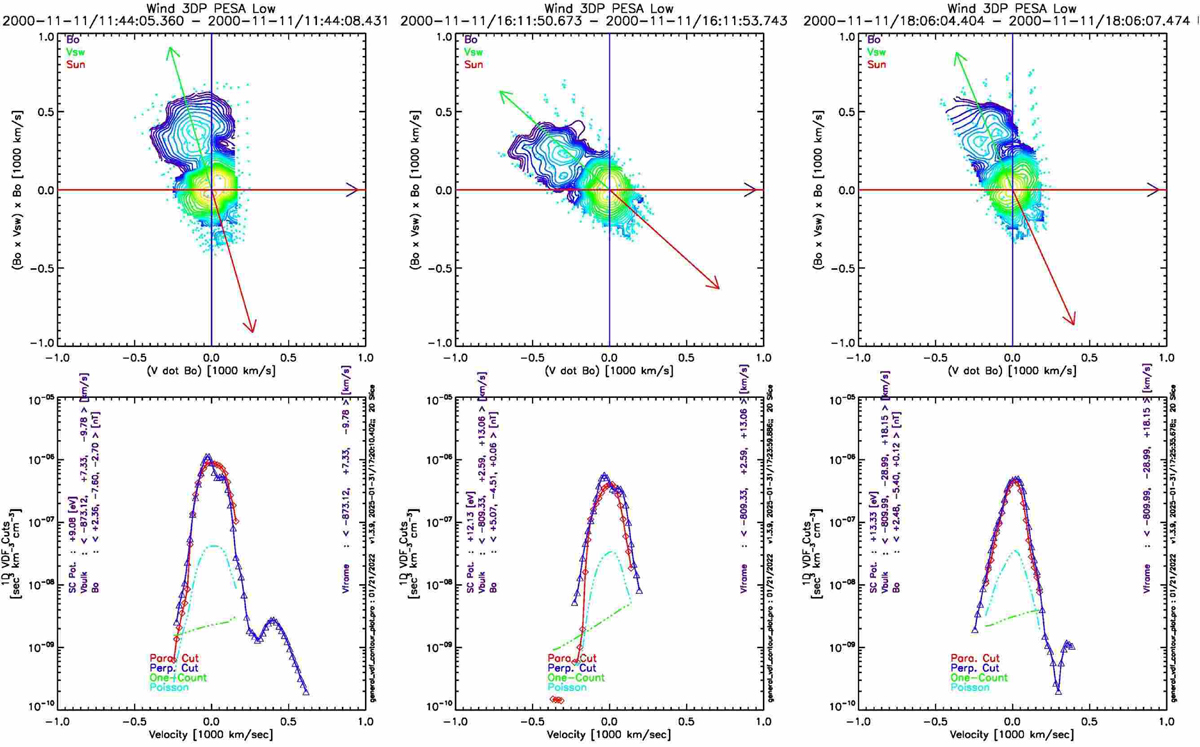
Fig. A.1.
Download original image
Examples of velocity distributions during the ejecta event on November 11, 2000 at three time intervals. (Top panels) 3D ion distribution of velocity analyzed to components parallel and perpendicular to the magnetic field, respectively. (Bottom panels) Parallel and perpendicular cuts of the 3D distribution in red and blue triangles, respectively.
Current usage metrics show cumulative count of Article Views (full-text article views including HTML views, PDF and ePub downloads, according to the available data) and Abstracts Views on Vision4Press platform.
Data correspond to usage on the plateform after 2015. The current usage metrics is available 48-96 hours after online publication and is updated daily on week days.
Initial download of the metrics may take a while.