Fig. 1.
Download original image
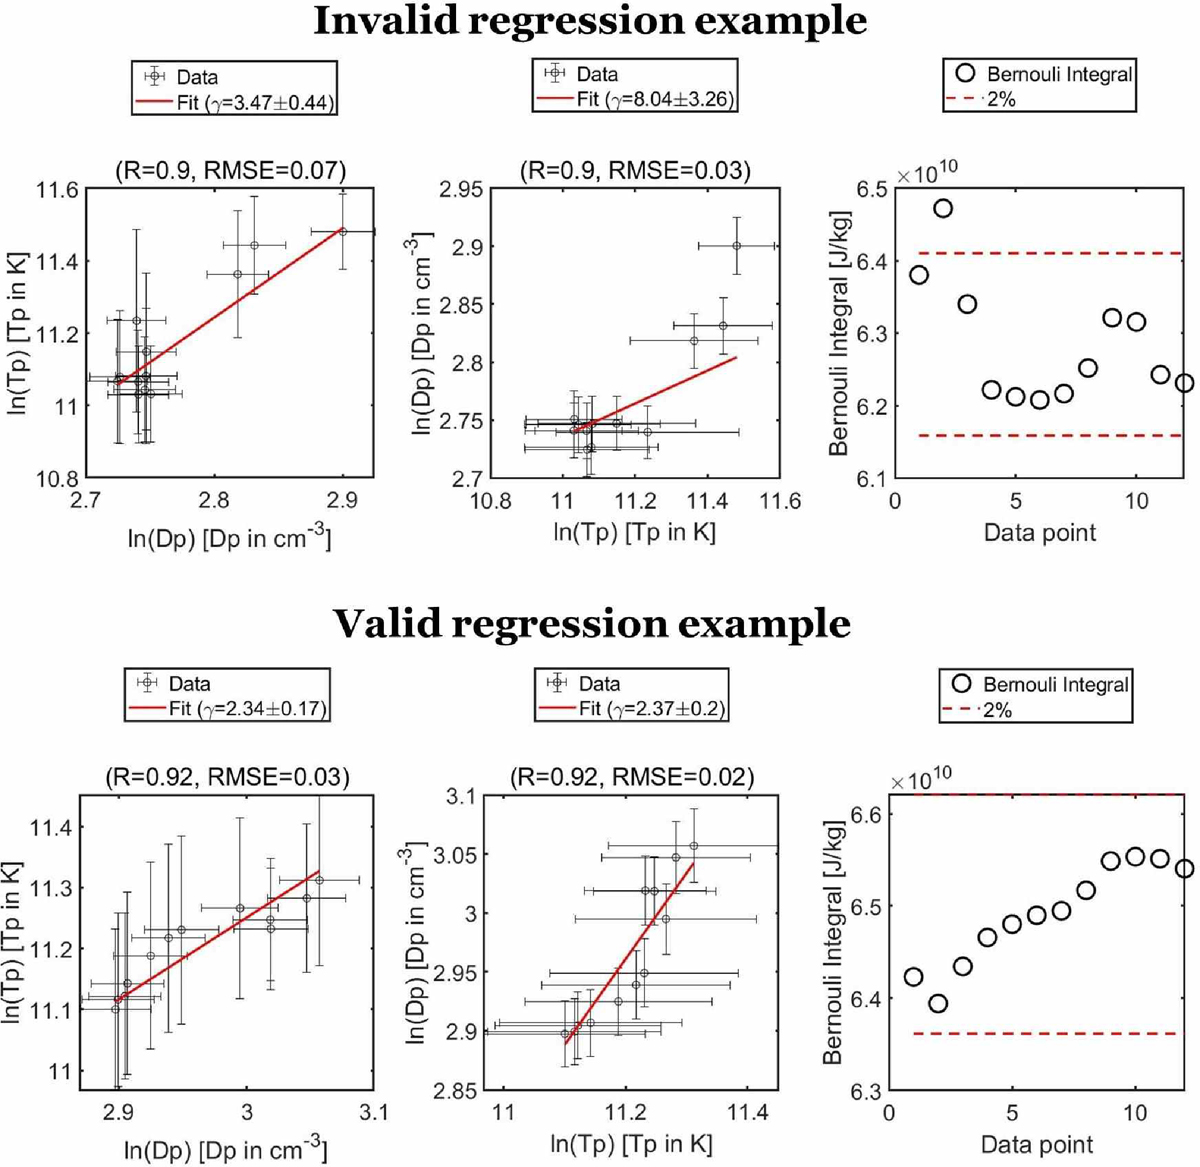
Example of an invalid (top panels) and valid (bottom panels) derivation of γ satisfying all the criteria set for this study. The left and middle panels show the cross plots of ln(Tp) versus ln(np) and ln(np) versus ln(Tp), respectively, with the Wind data shown as black circles (and the corresponding standard deviation with error bars) and the regressed values as the solid red lines. The right panels show Bernoulli’s integral estimate for the same window (black circles) along with the 2% limit (dashed red lines).
Current usage metrics show cumulative count of Article Views (full-text article views including HTML views, PDF and ePub downloads, according to the available data) and Abstracts Views on Vision4Press platform.
Data correspond to usage on the plateform after 2015. The current usage metrics is available 48-96 hours after online publication and is updated daily on week days.
Initial download of the metrics may take a while.