Open Access
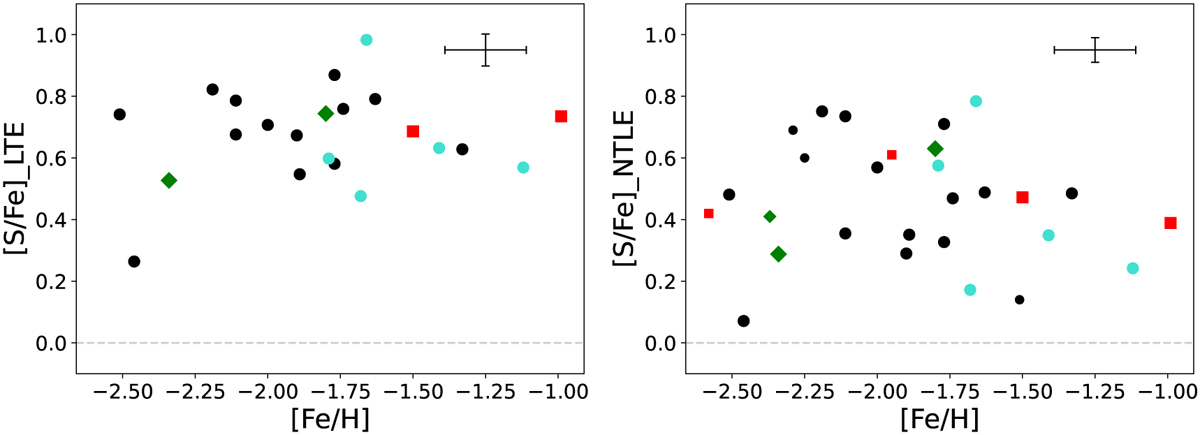
Fig. 9
Download original image
[S/Fe] versus [Fe/H] LTE (left panel) and NLTE (right panel) diagrams of the MINCE sample, the MINCE I (Cescutti et al. 2022) sample is identified by smaller symbols. Colors and symbols are the same as in Figure 8.
Current usage metrics show cumulative count of Article Views (full-text article views including HTML views, PDF and ePub downloads, according to the available data) and Abstracts Views on Vision4Press platform.
Data correspond to usage on the plateform after 2015. The current usage metrics is available 48-96 hours after online publication and is updated daily on week days.
Initial download of the metrics may take a while.