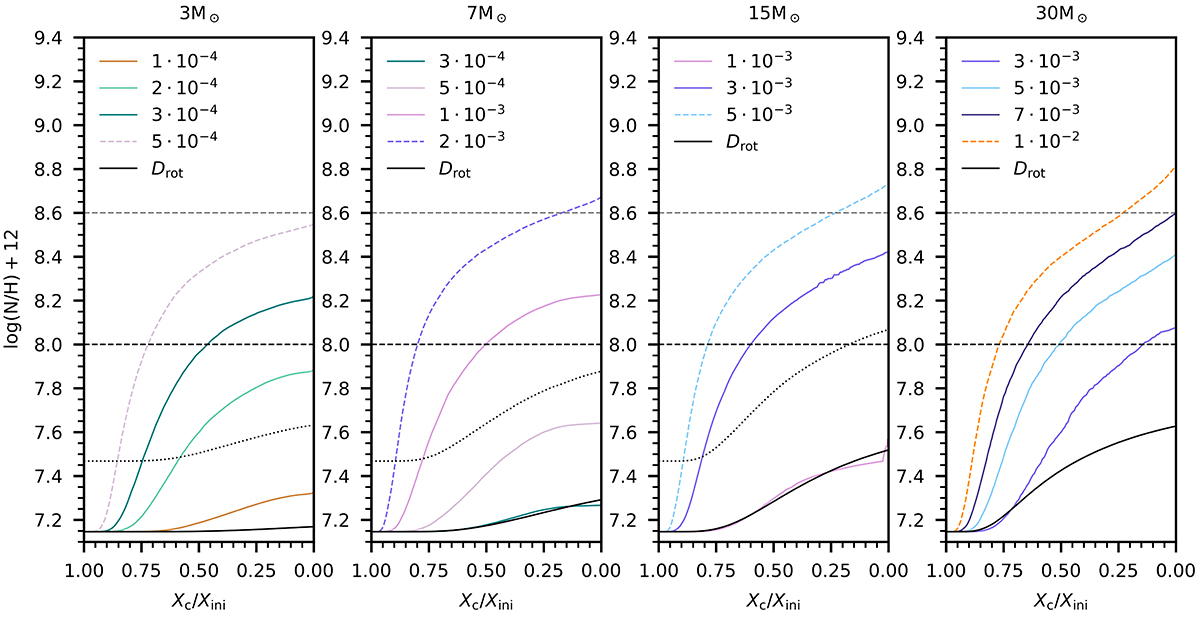
Fig. 3.
Download original image
Predicted evolution of the N/H abundance ratio at the stellar surface for models with IGW mixing. Models are computed for a metallicity that corresponds to the metallicity of the LMC. Different values of the legends indicate different values for the constant A (in seconds). The solid black line indicate models with only rotational mixing included, starting at 25 per cent of the initial Keplerian critical rotation frequency. The dotted black lines show the SYCLIST models, also starting at 25 per cent of the initial critical rotation frequency. The grey and black dashed horizontal lines indicate upper limits of stars in the LMC inferred by Martins et al. (2024) and Hunter et al. (2009), respectively. The models plotted with a dashed line evolve towards higher effective temperatures during the main sequence.
Current usage metrics show cumulative count of Article Views (full-text article views including HTML views, PDF and ePub downloads, according to the available data) and Abstracts Views on Vision4Press platform.
Data correspond to usage on the plateform after 2015. The current usage metrics is available 48-96 hours after online publication and is updated daily on week days.
Initial download of the metrics may take a while.