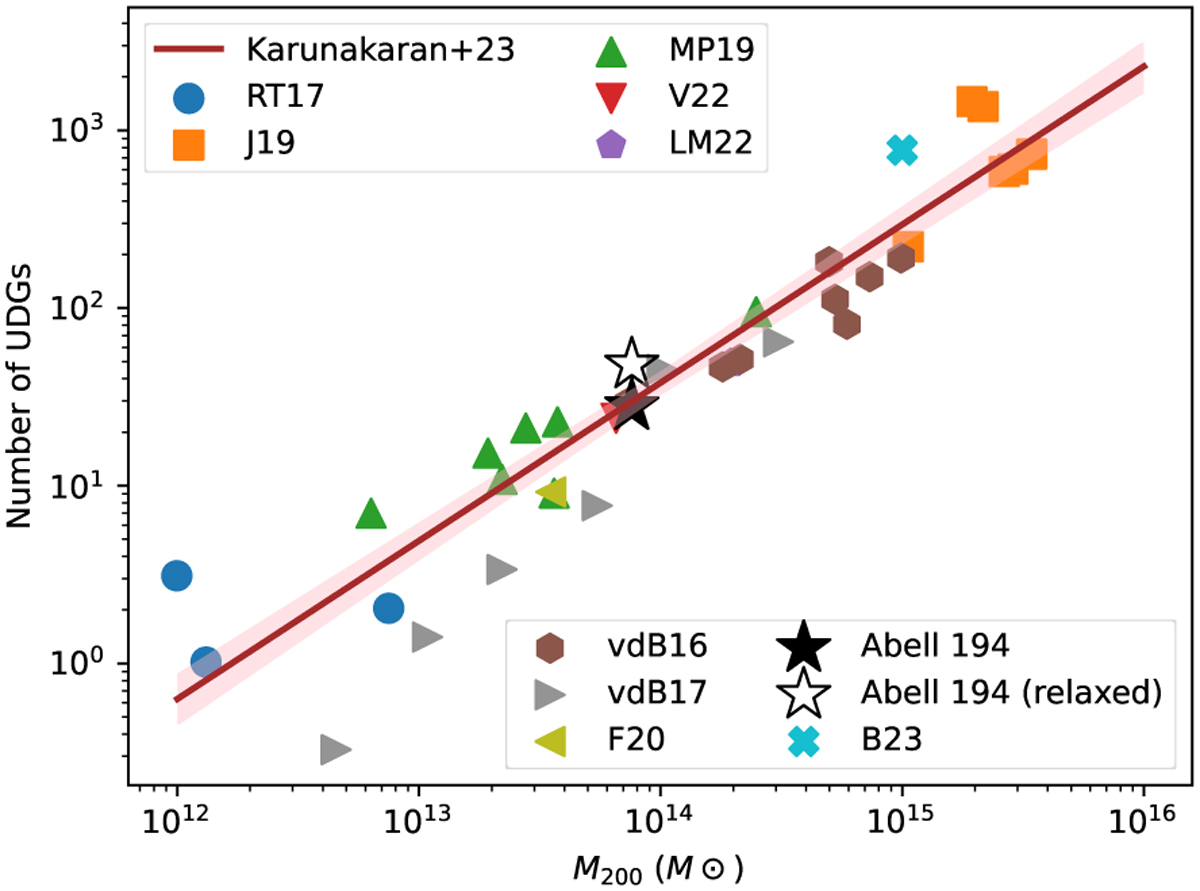
Fig. 9
Download original image
Number of UDGs as a function of halo mass, includes data from various studies. Cluster UDGs are represented by brown hexagons (van der Burg et al. 2016), orange squares (Janssens et al. 2019), upward green triangles (Mancera Piña et al. 2019), downward red triangles (Venhola et al. 2022), purple pentagons (La Marca et al. 2022), and cyan crosses (Bautista et al. 2023). Group UDGs are represented by grey right-pointing triangles (van der Burg et al. 2017), blue circles (Román & Trujillo 2017), and left-pointing olive triangles (Forbes et al. 2020). The UDGs reported in this work are shown as a black star, while the UDG sample with a relaxed definition, similar to Karunakaran & Zaritsky (2023), is represented by a hollow black star.
Current usage metrics show cumulative count of Article Views (full-text article views including HTML views, PDF and ePub downloads, according to the available data) and Abstracts Views on Vision4Press platform.
Data correspond to usage on the plateform after 2015. The current usage metrics is available 48-96 hours after online publication and is updated daily on week days.
Initial download of the metrics may take a while.