Fig. 16
Download original image
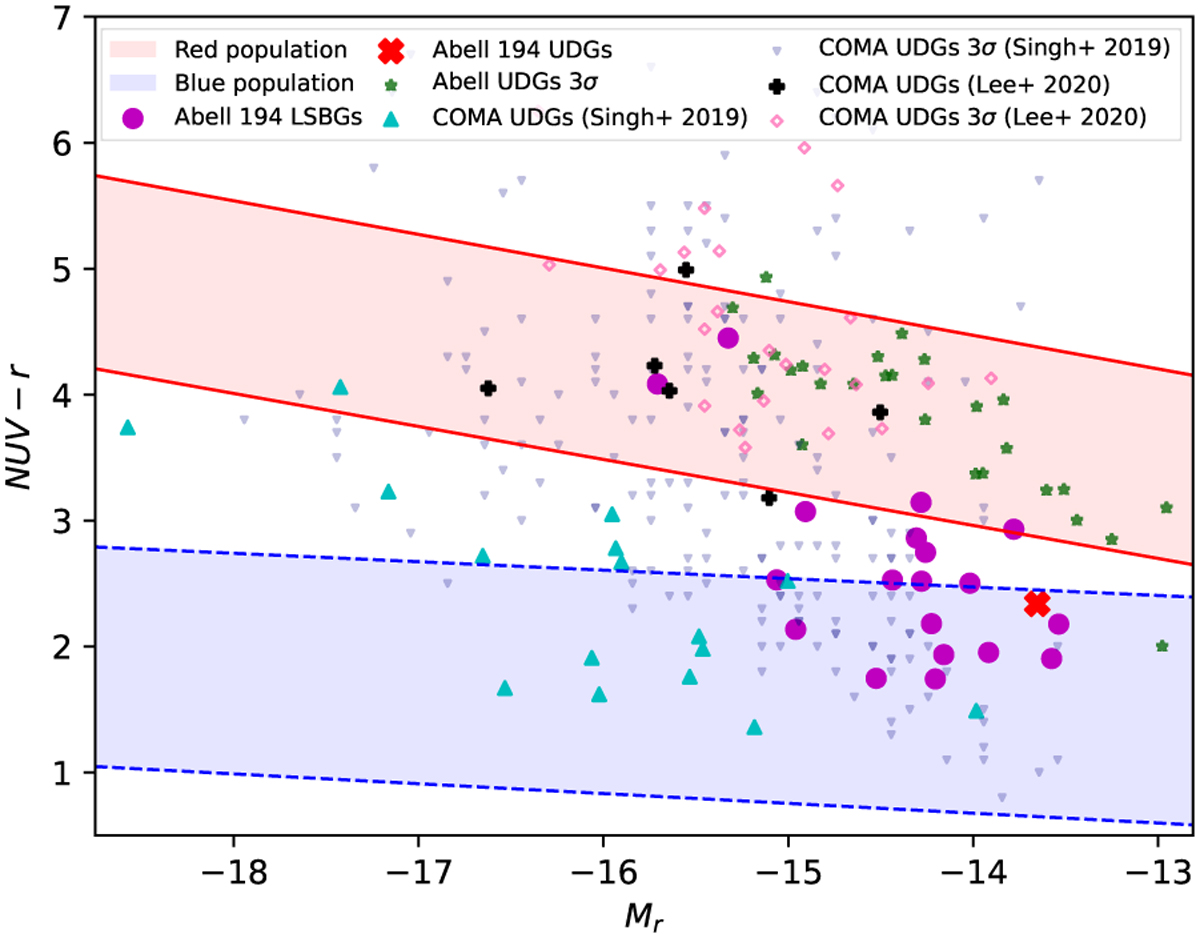
NUV – r colour plotted against the absolute magnitude in the r-band. The red region denotes the space occupied by the red-quiescent galaxy population, while the blue region represents the blue galaxy population (Singh et al. 2019). Magenta dots represent LSBGs, and red crosses represent UDGs with NUV detection in our sample. Green stars indicate the upper limits of NUV – r for UDGs in Abell 194 without NUV detection. Upward cyan triangles and black plus symbols represent UDGs from the Coma cluster reported by Singh et al. (2019) and Lee et al. (2020), respectively. Downward navy blue triangles and pink rhombuses denote the upper limits of NUV – r for UDGs in the Coma cluster from Singh et al. (2019) and Lee et al. (2020), respectively.
Current usage metrics show cumulative count of Article Views (full-text article views including HTML views, PDF and ePub downloads, according to the available data) and Abstracts Views on Vision4Press platform.
Data correspond to usage on the plateform after 2015. The current usage metrics is available 48-96 hours after online publication and is updated daily on week days.
Initial download of the metrics may take a while.