Fig. 13
Download original image
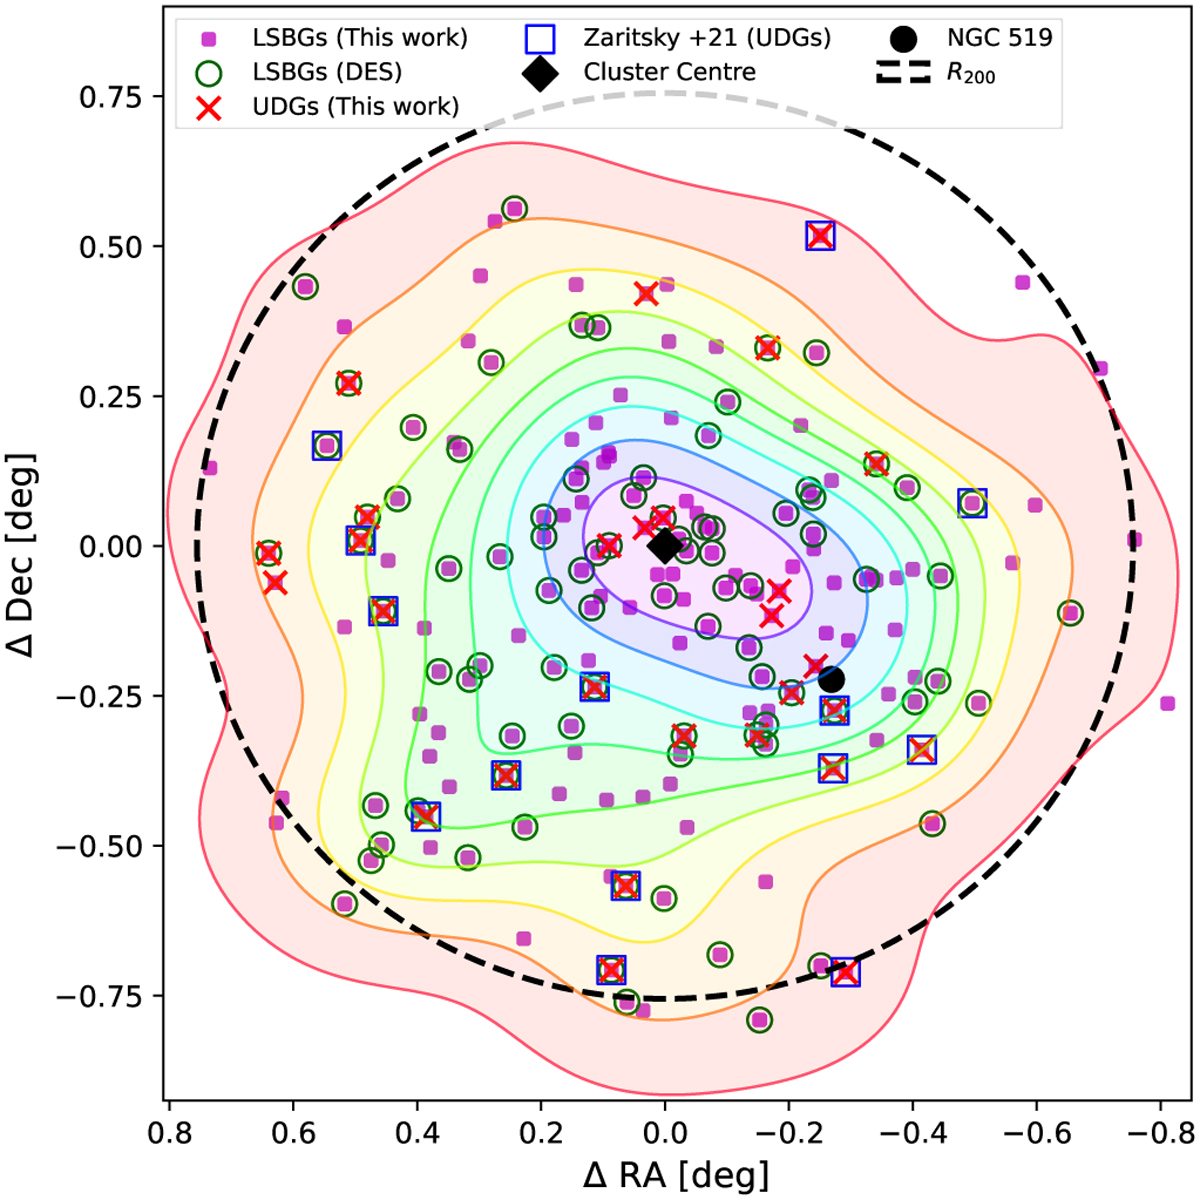
Spatial distribution of LSBGs and UDGs in the Abell 194 cluster. The LSBGs identified in this work are shown as magenta circles, and UDGs from this work are shown as red crosses. The LSBGs identified in DES by Tanoglidis et al. (2021b) and Thuruthipilly et al. (2024b) are marked with dark green circles, and UDGs reported in Zaritsky et al. (2023) are represented by blue squares. The KDE highlights regions with varying concentrations of LSBGs, ranging from blue to red, with blue indicating areas of higher density. The dashed black circle, the black diamond, and the black dot represent the virial radius, the cluster centre, and NGC 519, respectively.
Current usage metrics show cumulative count of Article Views (full-text article views including HTML views, PDF and ePub downloads, according to the available data) and Abstracts Views on Vision4Press platform.
Data correspond to usage on the plateform after 2015. The current usage metrics is available 48-96 hours after online publication and is updated daily on week days.
Initial download of the metrics may take a while.