Open Access
Fig. 2
Download original image
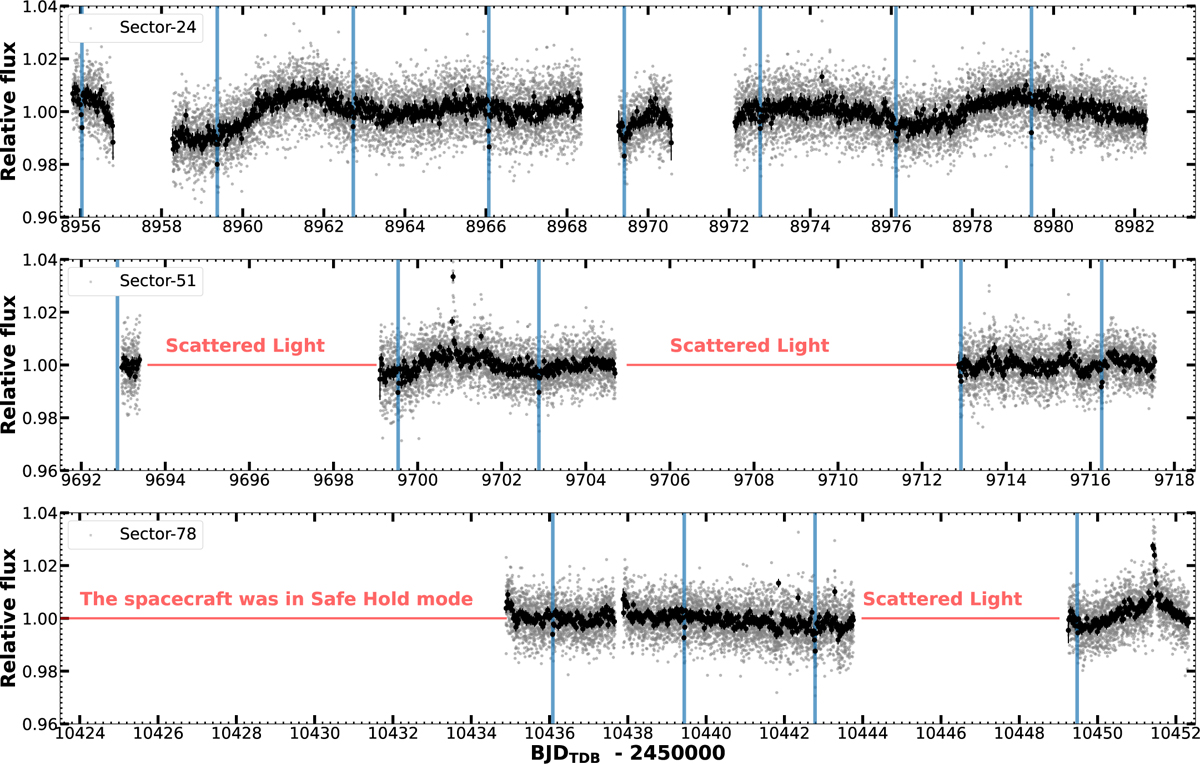
TESS PDC-SAP flux extracted from 2-min cadence data of TOI-2015. The target was observed in Sectors 24 (top), 51 (middle), and 78 (bottom). The light gray points show the 2-min cadence data, and the black points show the flux in 30-min bins. The transit locations of TOI-2015 b are shown with vertical blue lines.
Current usage metrics show cumulative count of Article Views (full-text article views including HTML views, PDF and ePub downloads, according to the available data) and Abstracts Views on Vision4Press platform.
Data correspond to usage on the plateform after 2015. The current usage metrics is available 48-96 hours after online publication and is updated daily on week days.
Initial download of the metrics may take a while.