Fig. 2.
Download original image
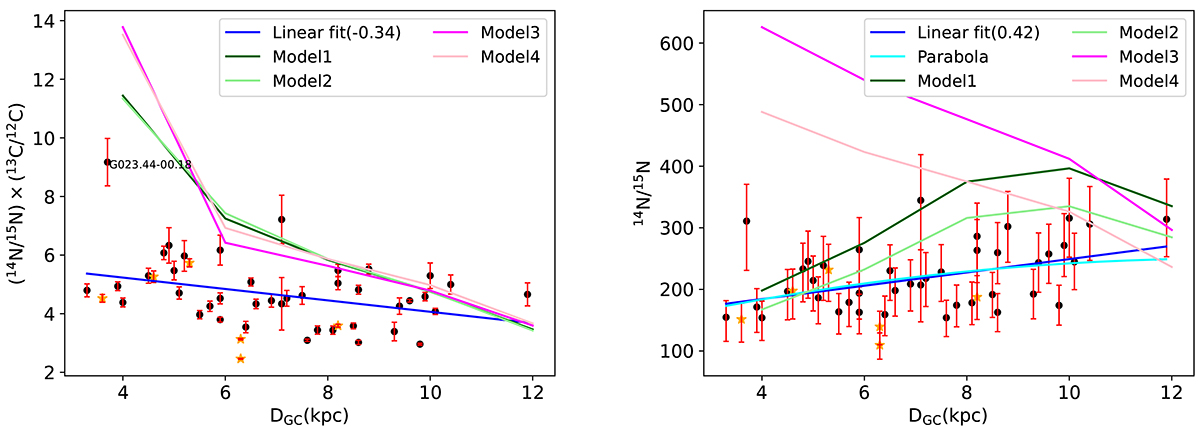
Abundance ratios of (14N/15N) × (13C/12C) (left) and 14N/15N with DGC (right). The filled black circles are sources with peak Tmb of H13CN 2–1 lower than 4 K, and the orange stars sources with peak Tmb higher than 4 K. The blue lines are linear fitting results. The cyan parabola was obtained by multiplying the linear regression fit of (14N/15N) × (13C/12C) given in Eq. (3) by the 12C/13C ratio (Eq. (2)). The green, dark green, pink, and magenta lines are the models from Colzi et al. (2022).
Current usage metrics show cumulative count of Article Views (full-text article views including HTML views, PDF and ePub downloads, according to the available data) and Abstracts Views on Vision4Press platform.
Data correspond to usage on the plateform after 2015. The current usage metrics is available 48-96 hours after online publication and is updated daily on week days.
Initial download of the metrics may take a while.