Fig. 4
Download original image
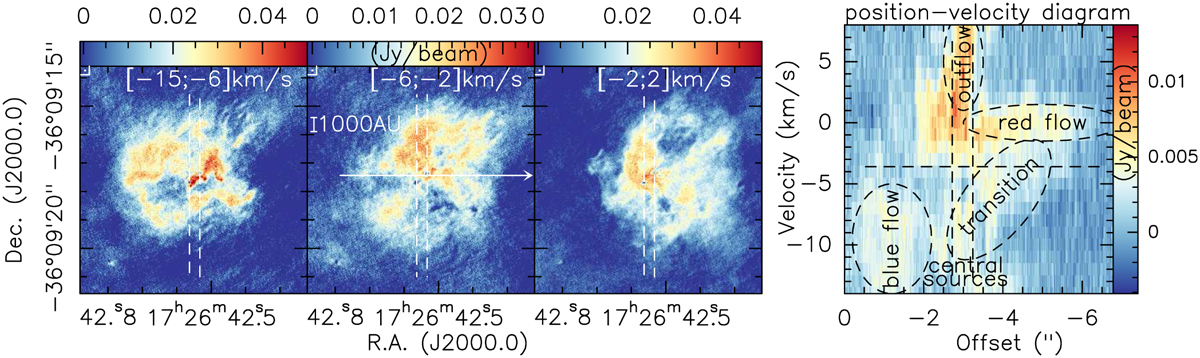
Velocity structure of the central region. The left three panels show integrated H2CO(32,2–22,1) maps for different velocity regimes as marked. The right panel presents a corresponding position–velocity cut from east to west along the line shown in the right panel of Fig. 3 and in the 2nd panel from left here. The dashed vertical lines in all panels mark the RA positions of the two central cores mm1 and mm2 (right and left dashed lines, respectively), where mm1 also drives a molecular outflow in northwest–southeast direction (Beuther et al. 2019). The horizontal dashed line in the pv-diagram shows the vLSR ∼ −3.6 km s−1 from Leurini et al. (2011a). Other features are marked and labeled.
Current usage metrics show cumulative count of Article Views (full-text article views including HTML views, PDF and ePub downloads, according to the available data) and Abstracts Views on Vision4Press platform.
Data correspond to usage on the plateform after 2015. The current usage metrics is available 48-96 hours after online publication and is updated daily on week days.
Initial download of the metrics may take a while.