Fig. 2
Download original image
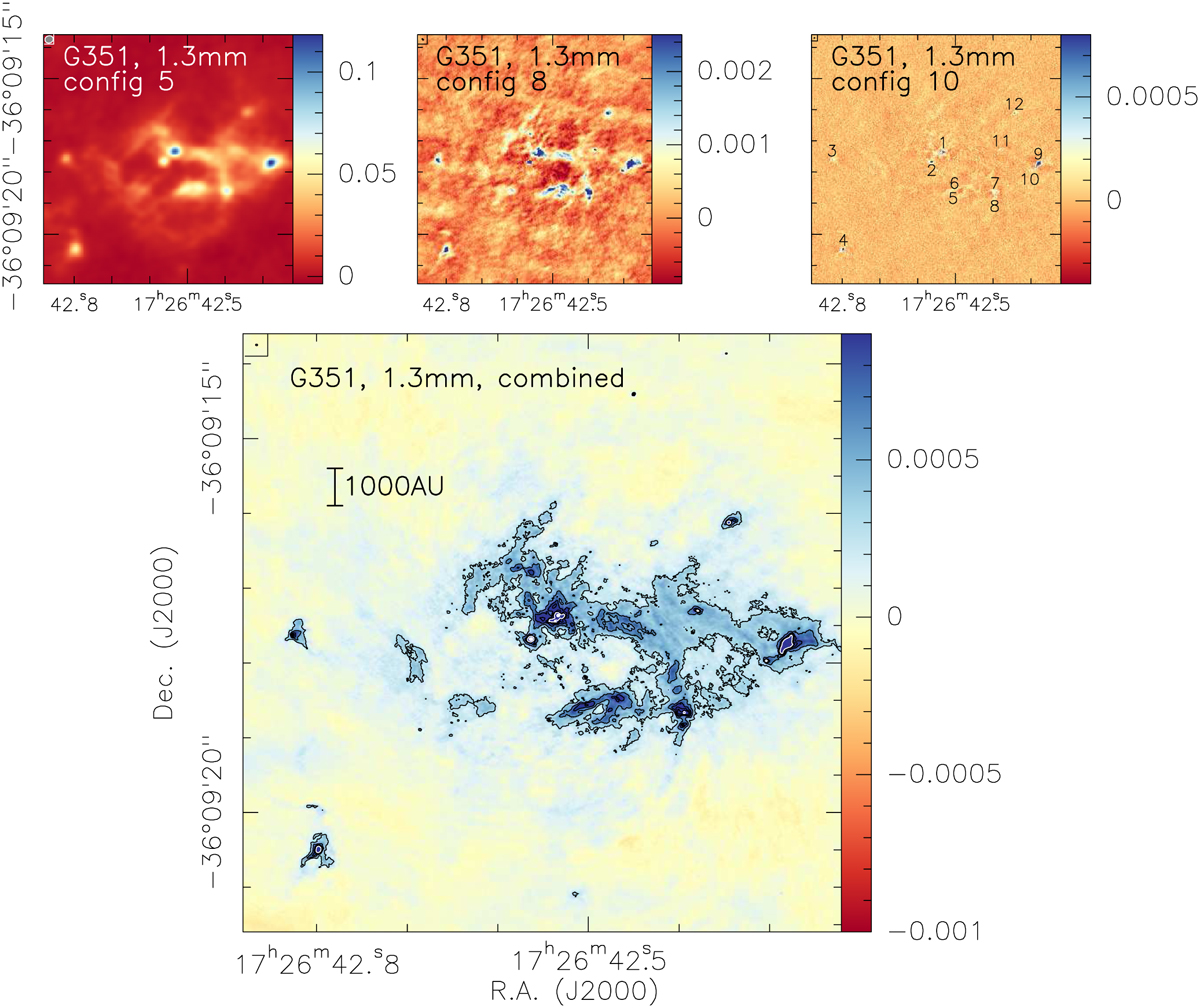
Compilation of the different ALMA 1.3 mm continuum data for the central G351 hot core region (little magenta box in Fig. 1). The top-three panels present from left to right the configuration 5 and 8 data from the DIHCA survey (Olguin et al. 2021, 2022; Taniguchi et al. 2023) and the highest resolution configuration 10 data (Beuther et al. 2019), all in R.A. (J2000) and Dec (J2000). In this panel, also the mm cores identified in Beuther et al. (2019) are labeled. The bottom panel then presents the combined merged data showing all spatial scales present in each individual dataset. The contour levels go from the 5 to 30σ level in steps of 5σ and then continue 80σ steps (1σ=60 µJybeam−1). The corresponding synthesized beams are shown in the top-left of each panel. A linear scale-bar is shown in the bottom panel.
Current usage metrics show cumulative count of Article Views (full-text article views including HTML views, PDF and ePub downloads, according to the available data) and Abstracts Views on Vision4Press platform.
Data correspond to usage on the plateform after 2015. The current usage metrics is available 48-96 hours after online publication and is updated daily on week days.
Initial download of the metrics may take a while.