Fig. 1
Download original image
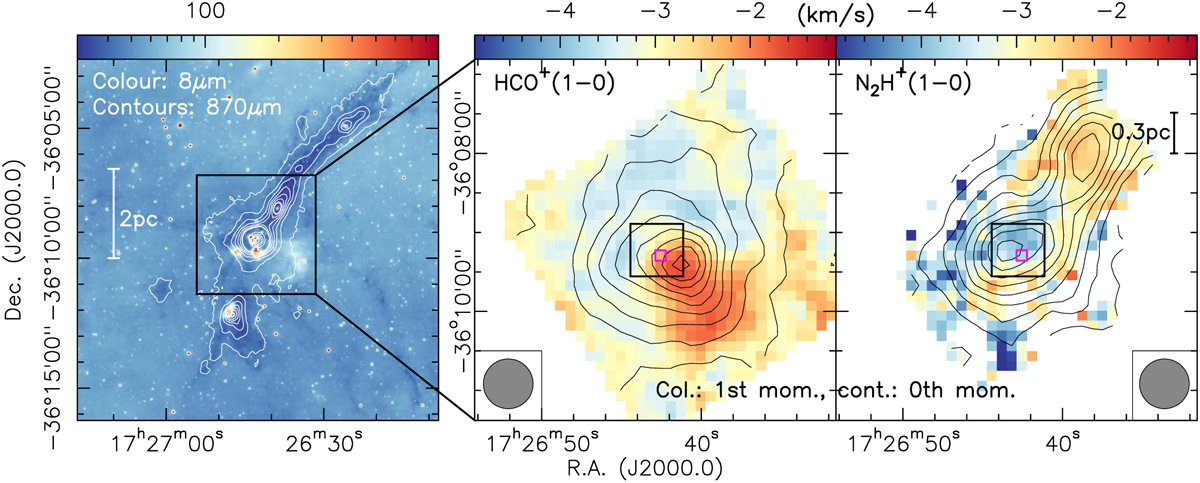
Overview of the G351 region. The left panel shows in color-scale the Spitzer 8 µm emission (Churchwell et al. 2009) and in contours the ATLASGAL 870 µm emission (Schuller et al. 2009). Contour levels start at the 4σ level of 240 mJy beam−1. The middle and right panels present the molecular emission from the HCO+(1–0) and N2H+(1–0) lines observed with the MALT90 survey (Jackson et al. 2013). In both cases, the colorscale shows the 1st moment maps (intensity-weighted peak velocities), and the contours present the integrated line emission or 0th moment from 5 to 95% of the respective peak emission. For N2H+(1–0), the 1st moment map is from the isolated hyperfine component shifted by +8.0 km s−1 to the vlsr. Since the rms increases toward the map edges, we masked the emission outside the 5% 0th moment map for the N2H+(1–0) map. The black and magenta boxes in the middle and right panels outline the areas shown in the following ALMA-IMF and ALMA central core images. Linear scale-bars are shown in the left and right panels, and the MALT90 beams are presented in the bottom corners.
Current usage metrics show cumulative count of Article Views (full-text article views including HTML views, PDF and ePub downloads, according to the available data) and Abstracts Views on Vision4Press platform.
Data correspond to usage on the plateform after 2015. The current usage metrics is available 48-96 hours after online publication and is updated daily on week days.
Initial download of the metrics may take a while.