Fig. 6
Download original image
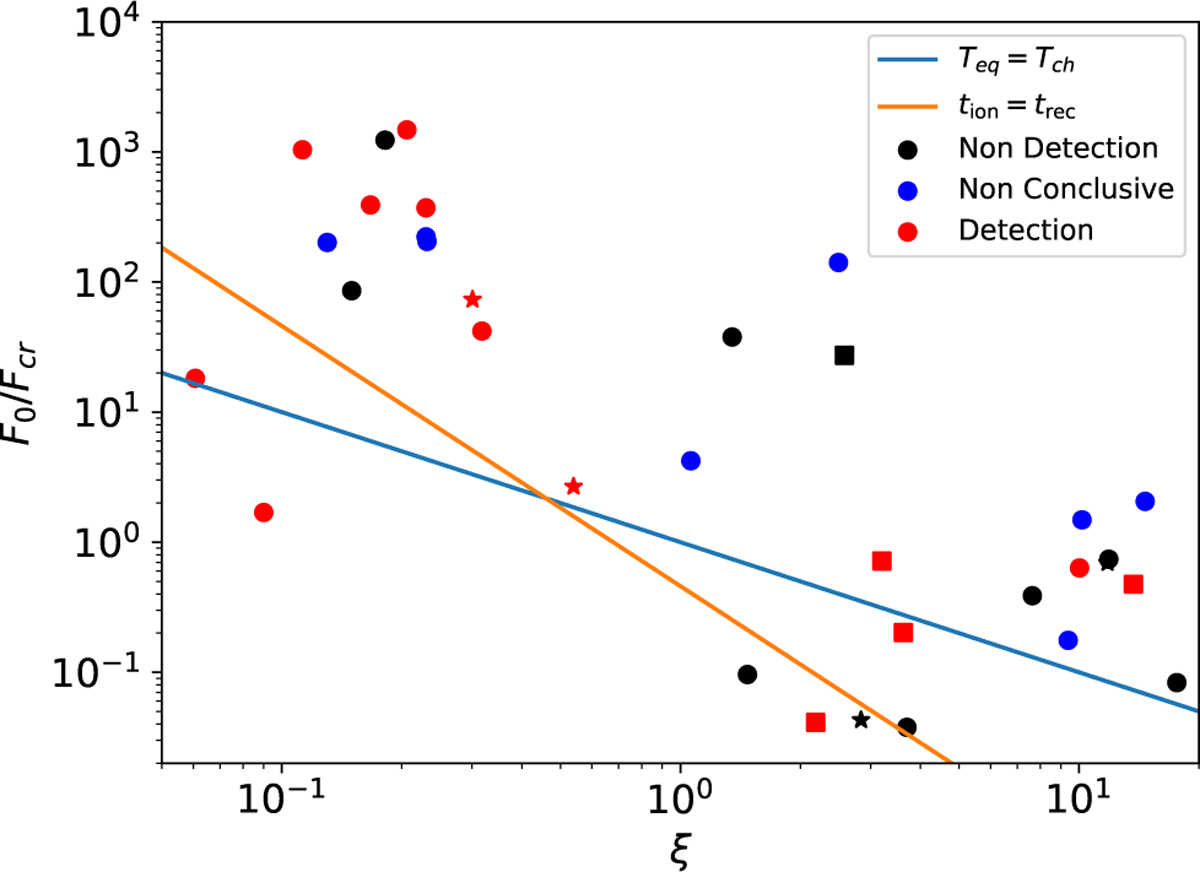
Distribution of close-in exoplanets with hydrogen observations. The red points represent the exoplanets in which hydrogen has been detected in Lyα or Hα, the blue points planets with inconclusive detection in hydrogen absorption, and the black points planets in which hydrogen is not detected. Squares, circles, and stars represent planets with Lyα, Hα, and both line observations, respectively. The straight lines show the condition Teq = Tch and tion = trec.
Current usage metrics show cumulative count of Article Views (full-text article views including HTML views, PDF and ePub downloads, according to the available data) and Abstracts Views on Vision4Press platform.
Data correspond to usage on the plateform after 2015. The current usage metrics is available 48-96 hours after online publication and is updated daily on week days.
Initial download of the metrics may take a while.