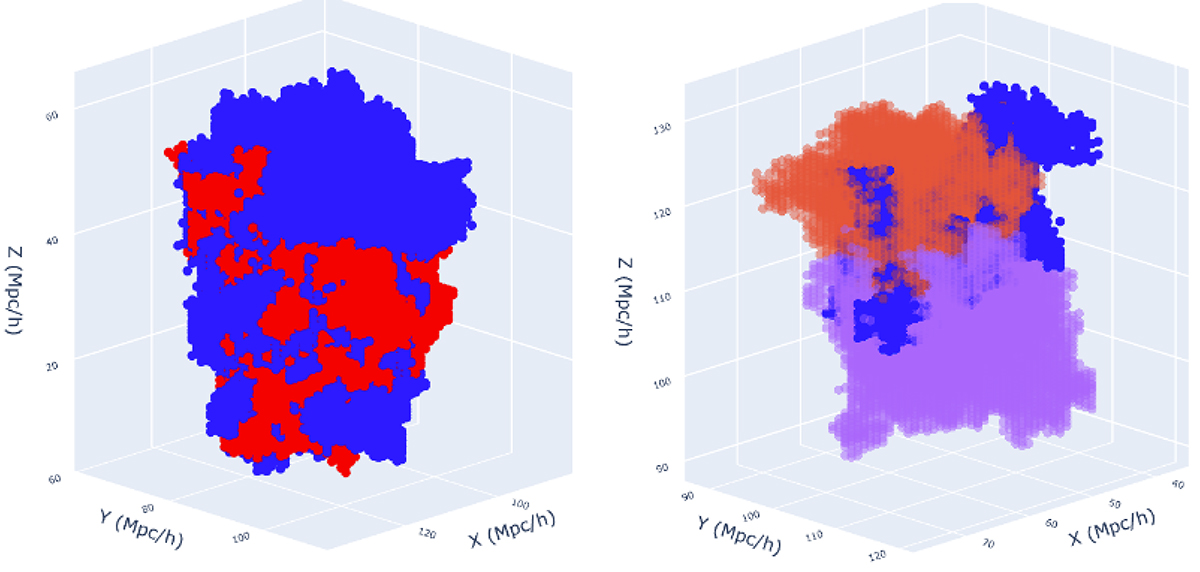
Fig. 8.
Download original image
Example of void volume overlaps between voids in the ideal and perturbed samples. Left: An ideal sample void (blue) overlapping with more than 50% with a perturbed sample void (red). Right: Different ideal sample void (blue, solid colour) overlapping with two perturbed sample voids, with different percentages (transparent colours).
Current usage metrics show cumulative count of Article Views (full-text article views including HTML views, PDF and ePub downloads, according to the available data) and Abstracts Views on Vision4Press platform.
Data correspond to usage on the plateform after 2015. The current usage metrics is available 48-96 hours after online publication and is updated daily on week days.
Initial download of the metrics may take a while.