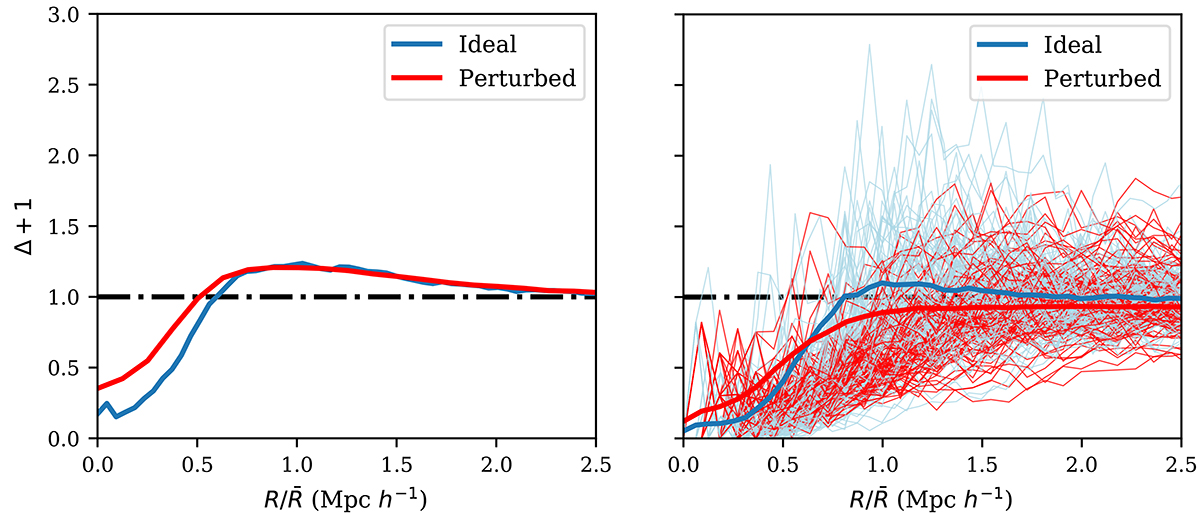
Fig. 7.
Download original image
Stacked radial number density profiles for the unfiltered (left) and filtered (right) ideal and perturbed sample voids. The horizontal line indicates the average number density of galaxies in the simulation box. The radii have been normalised to the average equivalent radii. For the filtered case, we also show the individual profiles of the 100 largest voids (thin lines, ideal sample – blue; perturbed sample – red).
Current usage metrics show cumulative count of Article Views (full-text article views including HTML views, PDF and ePub downloads, according to the available data) and Abstracts Views on Vision4Press platform.
Data correspond to usage on the plateform after 2015. The current usage metrics is available 48-96 hours after online publication and is updated daily on week days.
Initial download of the metrics may take a while.