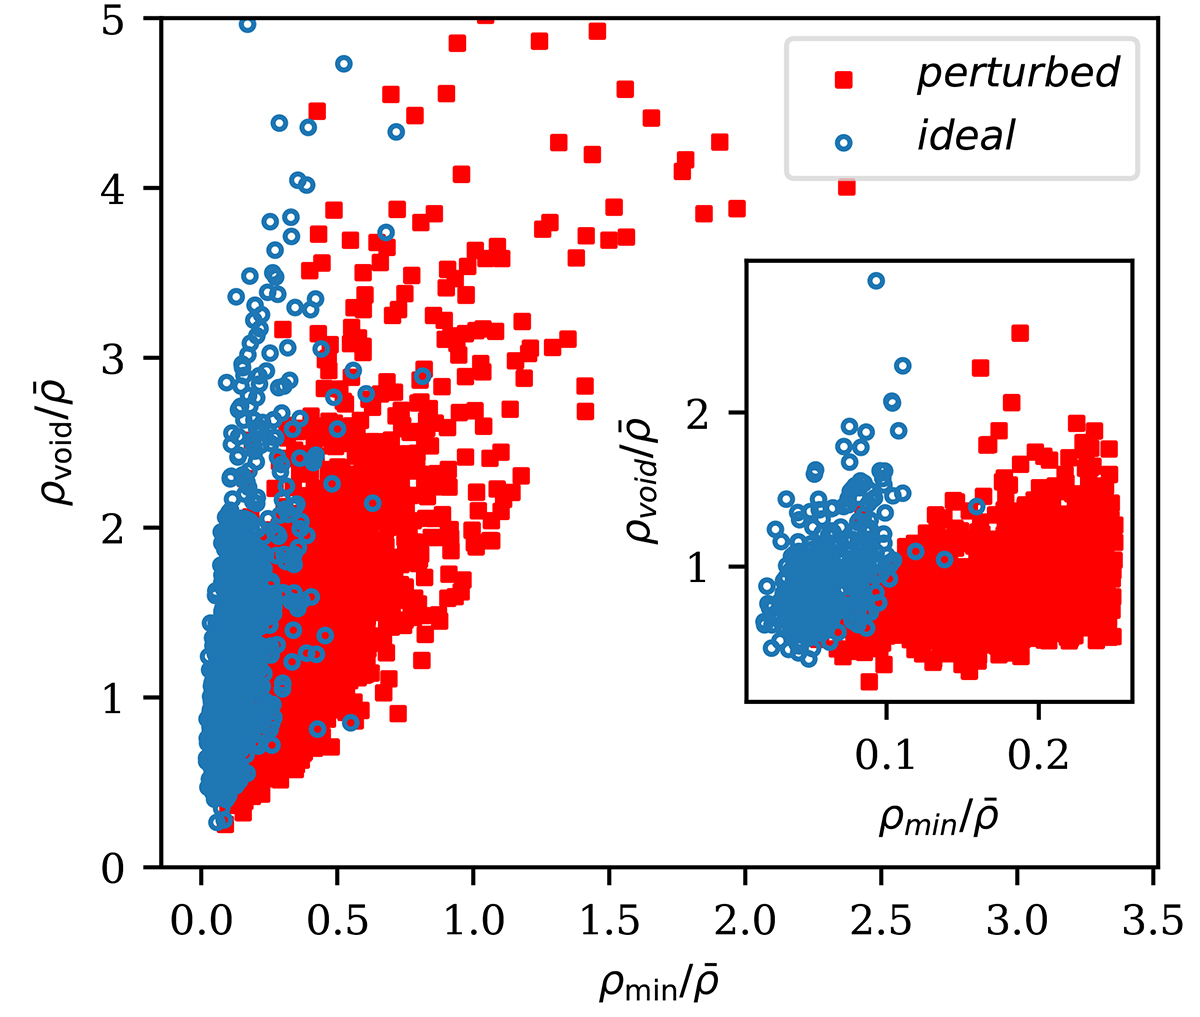
Fig. 4.
Download original image
Main plot: Void density parameters. The plot shows the correlation between the overall void density and the minimum void density for the unfiltered ideal (blue open circles) and perturbed samples (red squares). Inset: Same for medium-filtered voids. Both density parameters have been normalised to the average density in the box, ![]() .
.
Current usage metrics show cumulative count of Article Views (full-text article views including HTML views, PDF and ePub downloads, according to the available data) and Abstracts Views on Vision4Press platform.
Data correspond to usage on the plateform after 2015. The current usage metrics is available 48-96 hours after online publication and is updated daily on week days.
Initial download of the metrics may take a while.