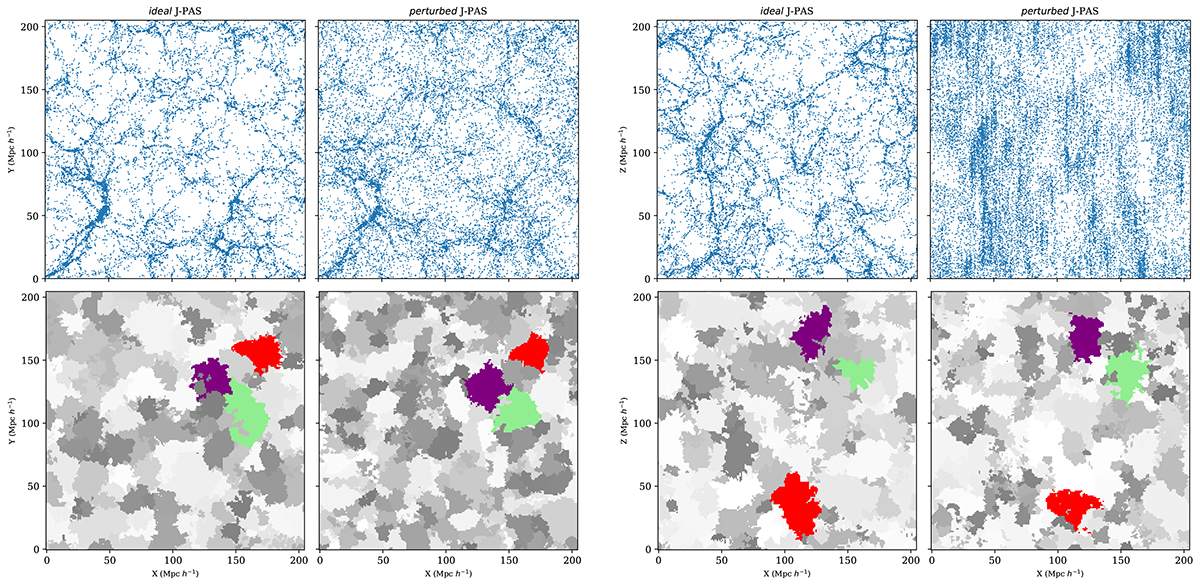
Fig. 3.
Download original image
Ideal and perturbed J-PAS galaxy mock samples (top panels) and void distributions (bottom panels) in X − Y and X − Z projections. We show a 10 Mpc-thick slice for each projection. The effect of redshift errors on the galaxy distribution is evident in the X − Z projection of the perturbed sample (fourth column, top panel). Cross-sections of voids are shown in greyscale, while colours highlight voids that have more than 50% volume overlap between the ideal and perturbed samples (see Sect. 3.2.1 for further discussion). A visual comparison reveals that voids detected in the ideal sample tend to fragment into various-sized voids in the perturbed sample.
Current usage metrics show cumulative count of Article Views (full-text article views including HTML views, PDF and ePub downloads, according to the available data) and Abstracts Views on Vision4Press platform.
Data correspond to usage on the plateform after 2015. The current usage metrics is available 48-96 hours after online publication and is updated daily on week days.
Initial download of the metrics may take a while.