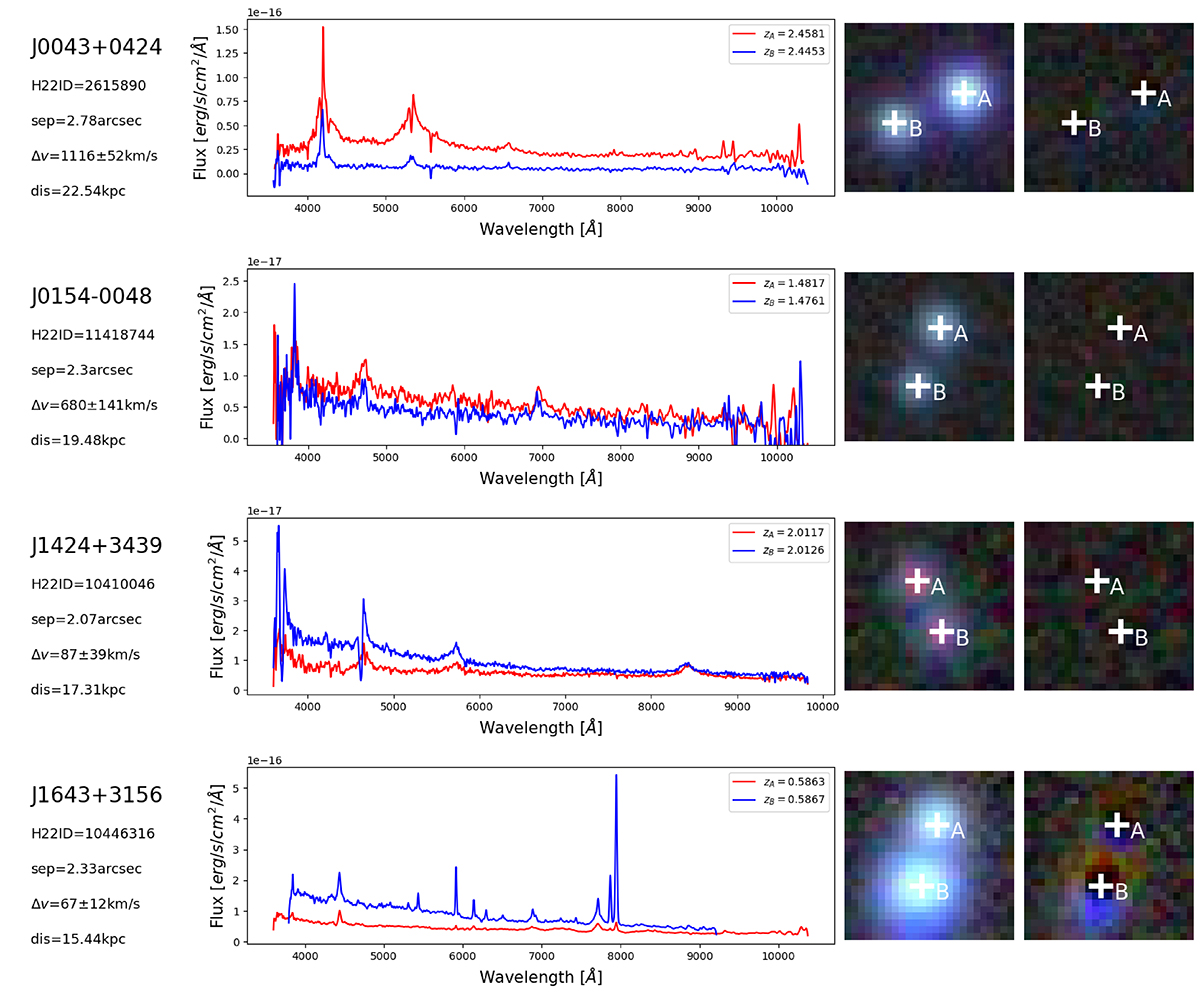
Fig. A.1.
Download original image
Data for four dual quasars, verified using publicly available spectral datasets. On the left, we provide essential details: Δv represents the velocity difference, ‘sep’ denotes the image separation of the two quasars, and ‘dis’ indicates the projected separation in the line-of-sight direction at lower redshift. The second column displays the spectra, where the fluxes have been smoothed using a Gaussian kernel with a standard deviation of 5 Å. The third column features the grz colour image from the DESI-LS DR10, while the final column shows the residual image derived from DESI-LS DR10.
Current usage metrics show cumulative count of Article Views (full-text article views including HTML views, PDF and ePub downloads, according to the available data) and Abstracts Views on Vision4Press platform.
Data correspond to usage on the plateform after 2015. The current usage metrics is available 48-96 hours after online publication and is updated daily on week days.
Initial download of the metrics may take a while.