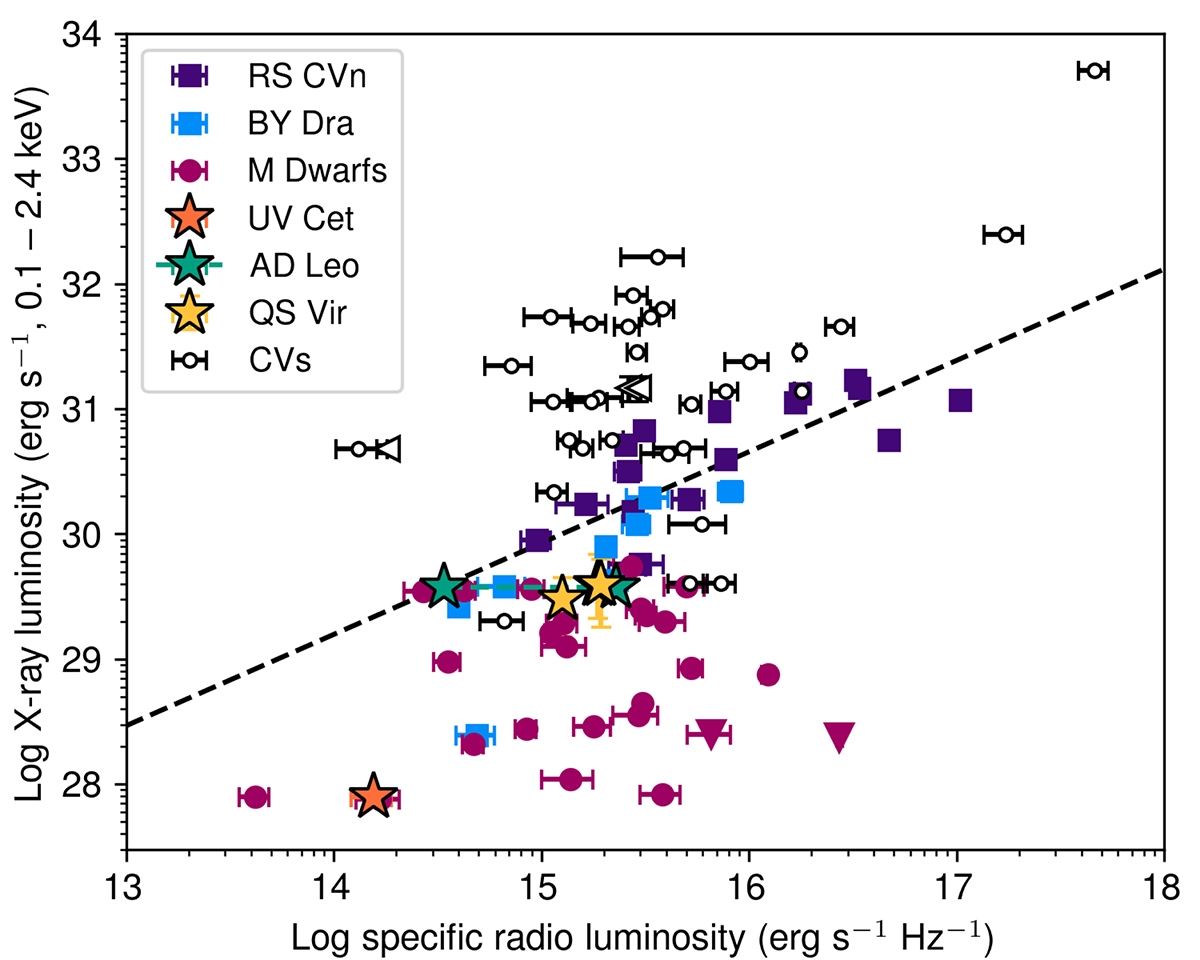
Fig. 8.
Download original image
S-band QS Vir detections (see Table 2) on the LR − LX diagram, alongside M dwarfs (spectral type M1.5 to M8.5) and CAS systems detected in VLASS from the Yiu et al. (2024) dataset as well as AD Leo from Villadsen & Hallinan (2019). We also plot a sample of CVs from Coppejans et al. (2015, 2016), Barrett et al. (2020), Hewitt et al. (2020), and Ridder et al. (2023) that were within 15″ of a source in the Second ROSAT All-Sky Survey Catalog (Boller et al. 2016). The black dashed line represents the Güdel-Benz relation (Williams et al. 2014). Two M dwarfs from the Yiu et al. (2024) sample were excluded from this plot, as their X-ray luminosities were below 1026 erg s−1. UV Cet and AD Leo (discussed above), have also been highlighted. The X-ray luminosities are dominated by systematics, so error bars are not shown, except for QS Vir.
Current usage metrics show cumulative count of Article Views (full-text article views including HTML views, PDF and ePub downloads, according to the available data) and Abstracts Views on Vision4Press platform.
Data correspond to usage on the plateform after 2015. The current usage metrics is available 48-96 hours after online publication and is updated daily on week days.
Initial download of the metrics may take a while.