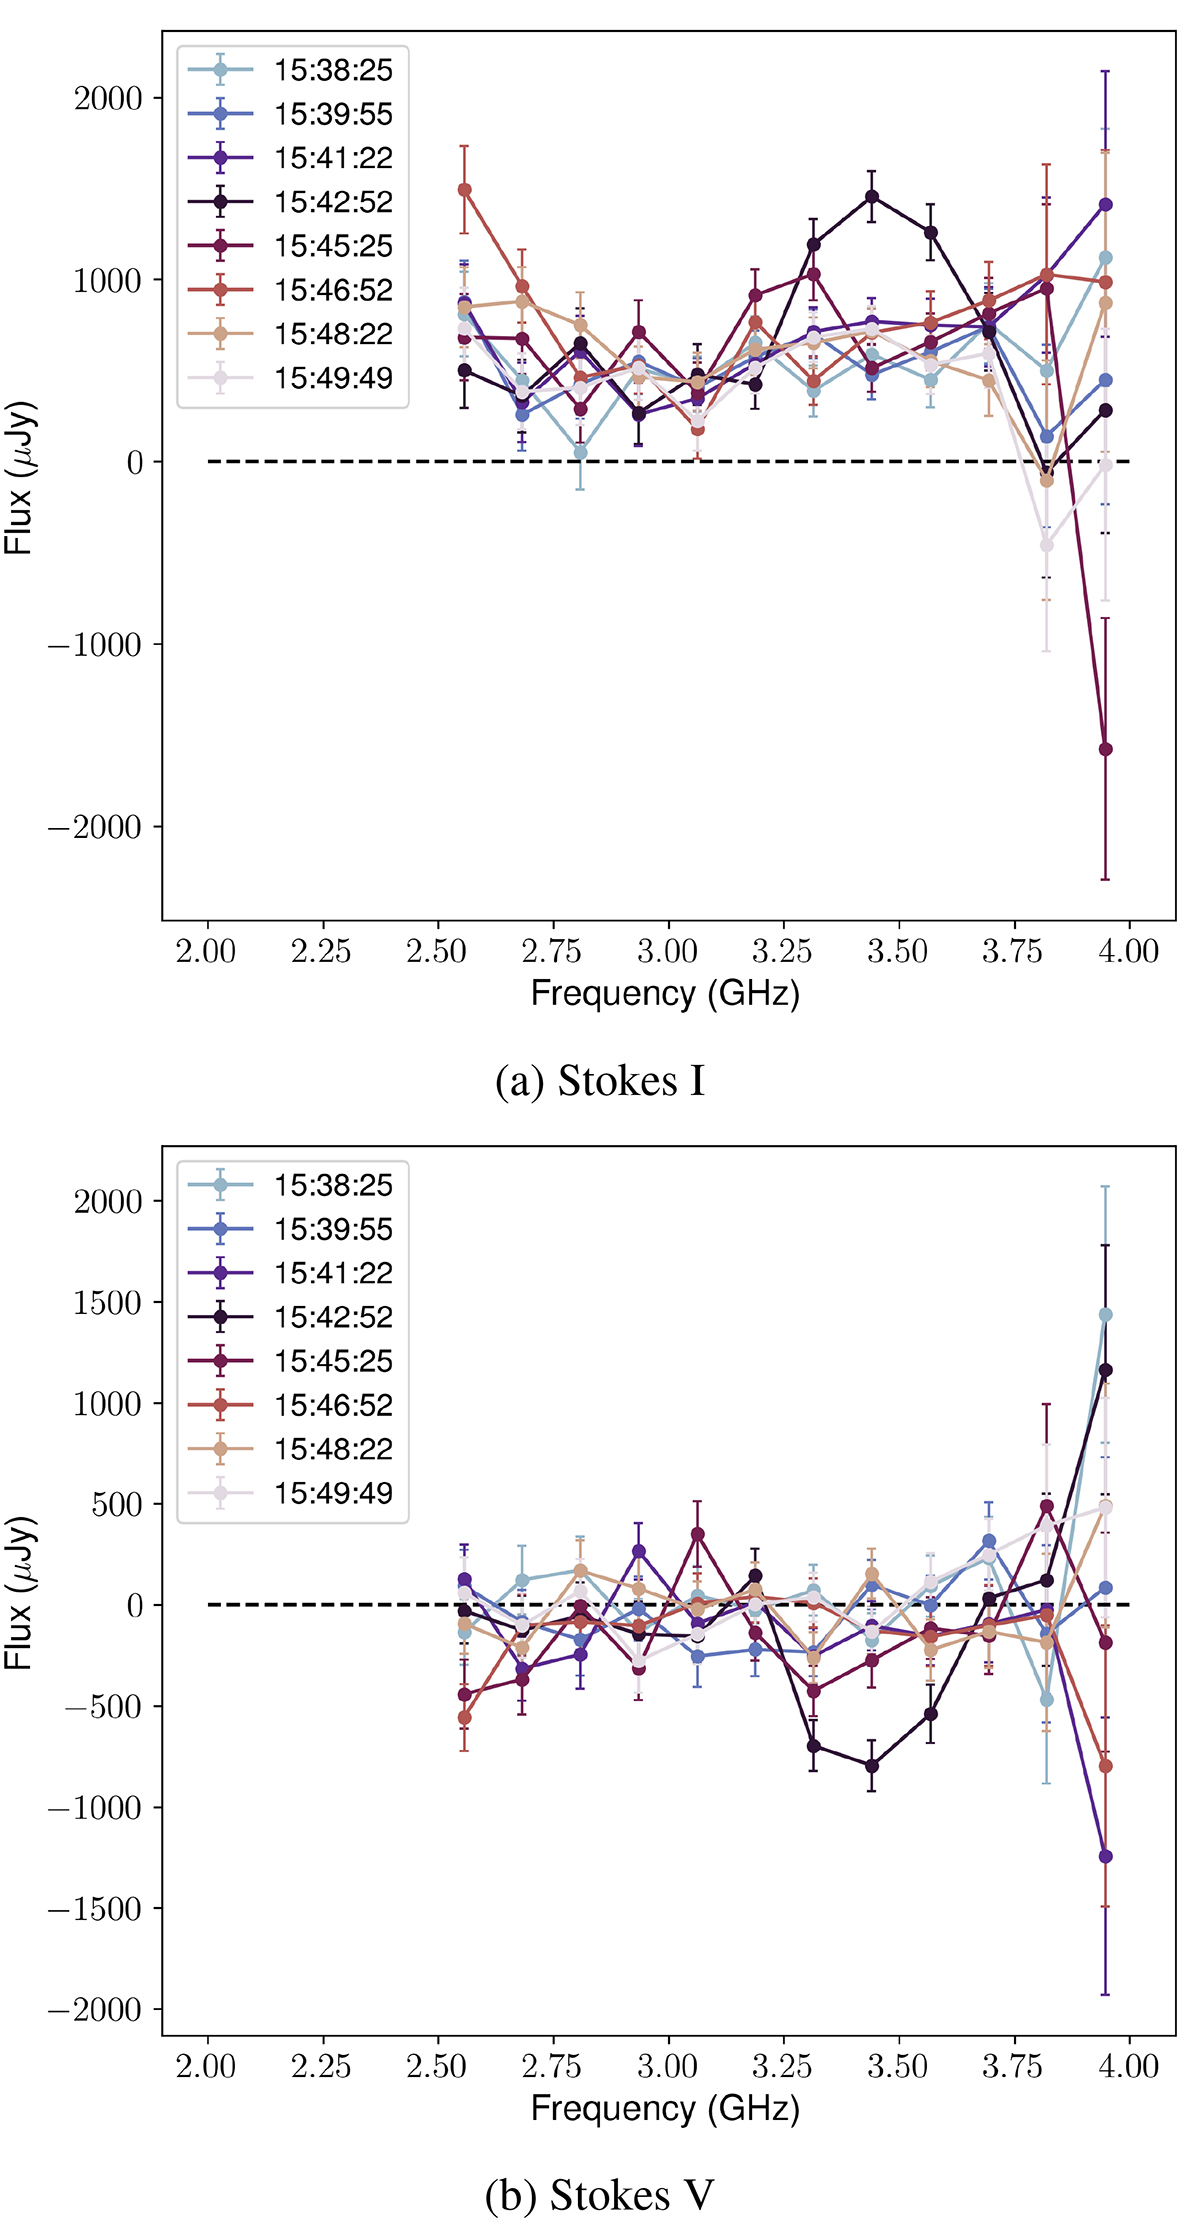
Fig. 7.
Download original image
S-band SED of QS Vir on 28 Nov. 2022 in Stokes I (a) and V (b), binned in time as in Fig. 5 with 16 frequency bins. All times are UTC. We do not trust the variation in flux near 4 GHz because it lies near the edge of the frequency band. Similarly to Fig. 6, a spectral feature centred on 3.5 GHz rises to a maximum at 15:42:52 and decays from 15:45:25. This peak is maximally circularly polarised at 15:42:52 (55 ± 10%) and decreases at 15:45:25.
Current usage metrics show cumulative count of Article Views (full-text article views including HTML views, PDF and ePub downloads, according to the available data) and Abstracts Views on Vision4Press platform.
Data correspond to usage on the plateform after 2015. The current usage metrics is available 48-96 hours after online publication and is updated daily on week days.
Initial download of the metrics may take a while.