Open Access
Fig. 5.
Download original image
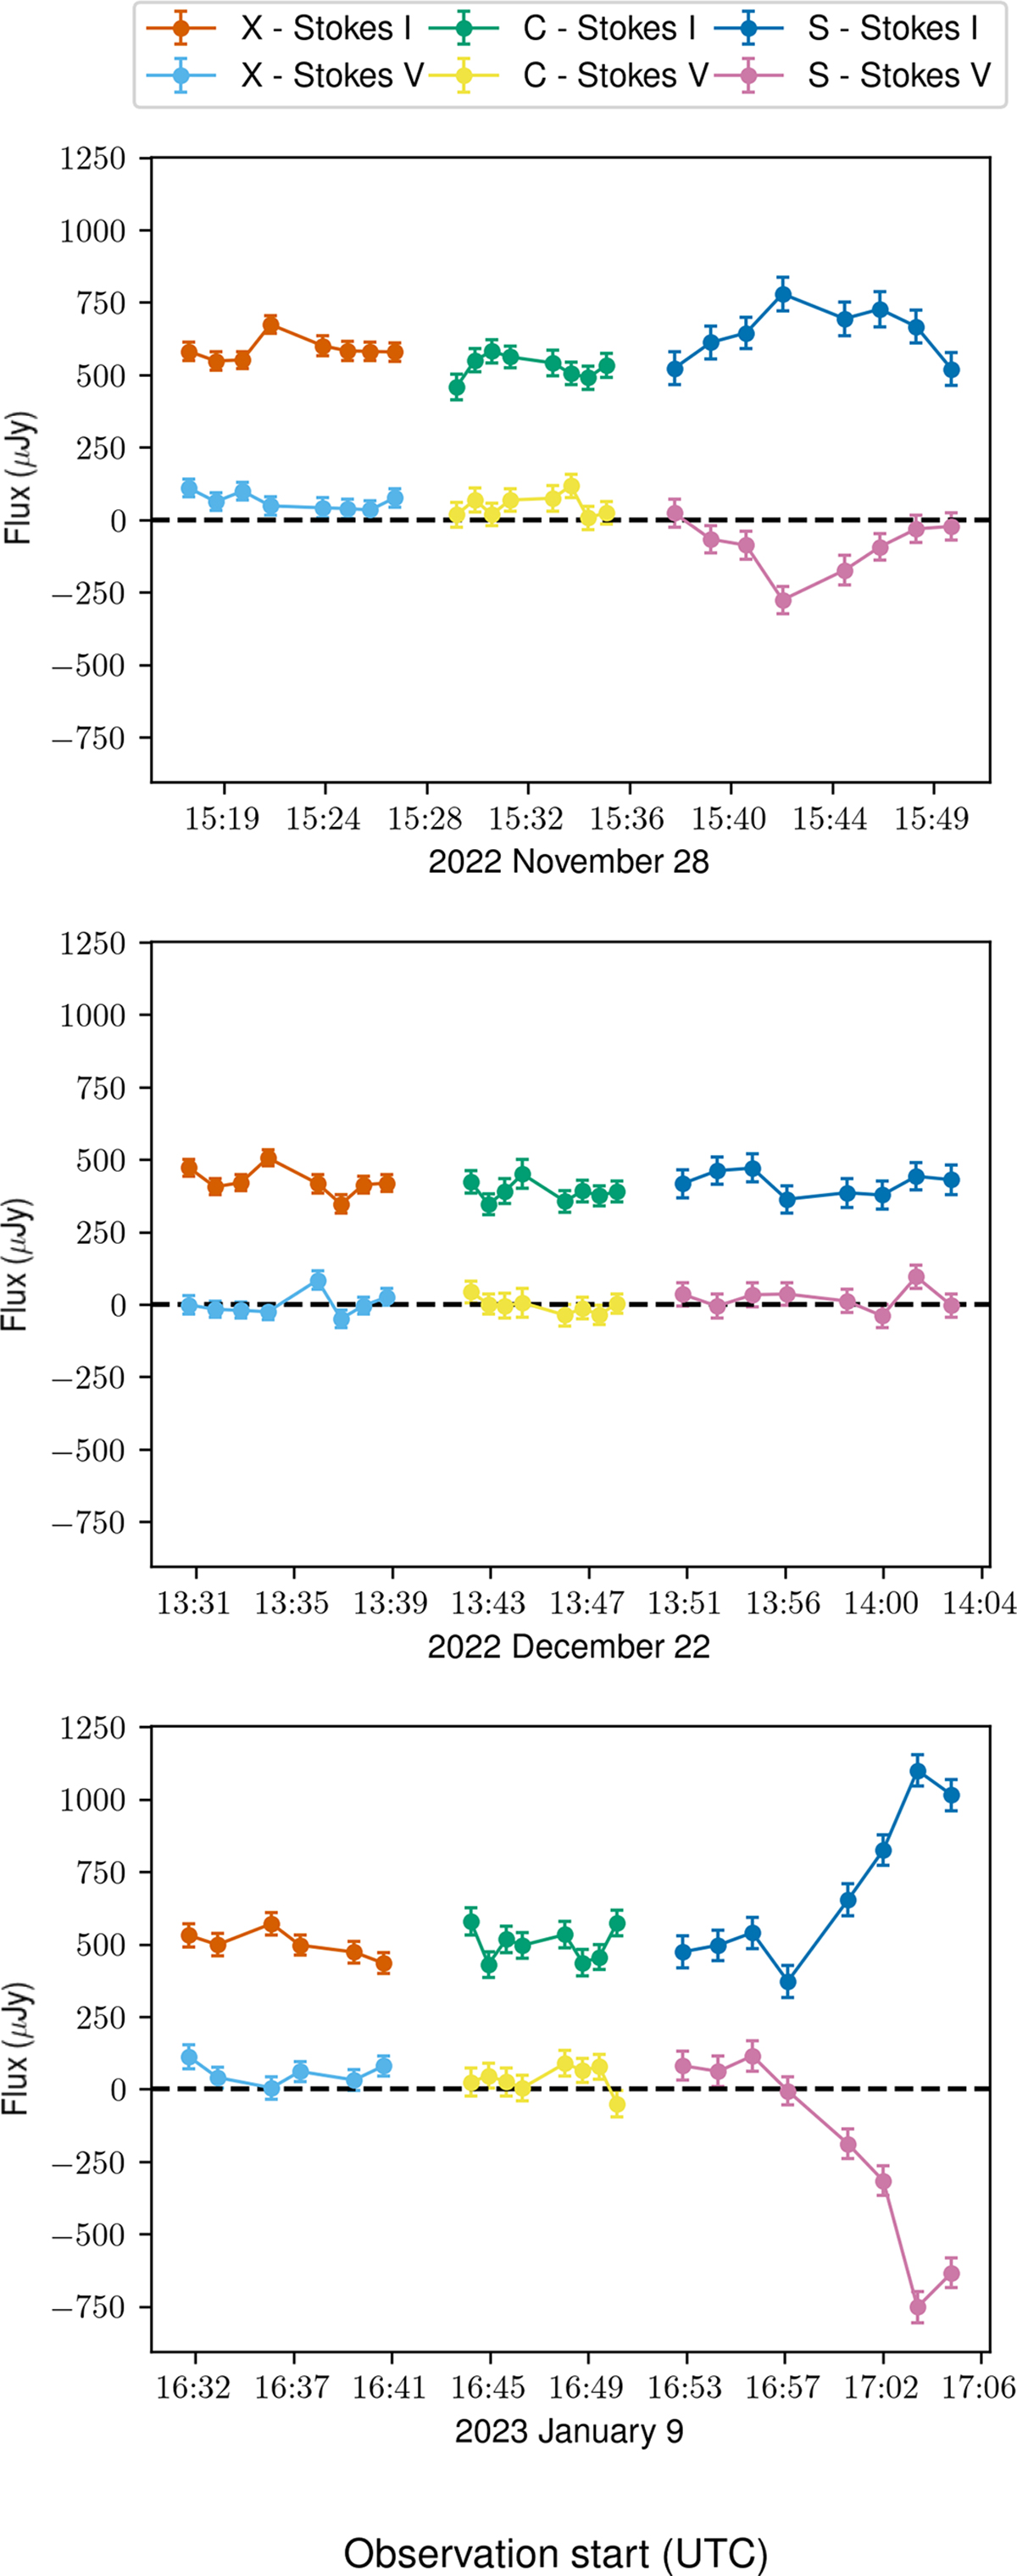
Light curve data for all three epochs and frequency bands in Stokes I and V. We see the most variability in S-band in November and January, where increasing Stokes I corresponds to increasingly negative Stokes V.
Current usage metrics show cumulative count of Article Views (full-text article views including HTML views, PDF and ePub downloads, according to the available data) and Abstracts Views on Vision4Press platform.
Data correspond to usage on the plateform after 2015. The current usage metrics is available 48-96 hours after online publication and is updated daily on week days.
Initial download of the metrics may take a while.