Fig. 2.
Download original image
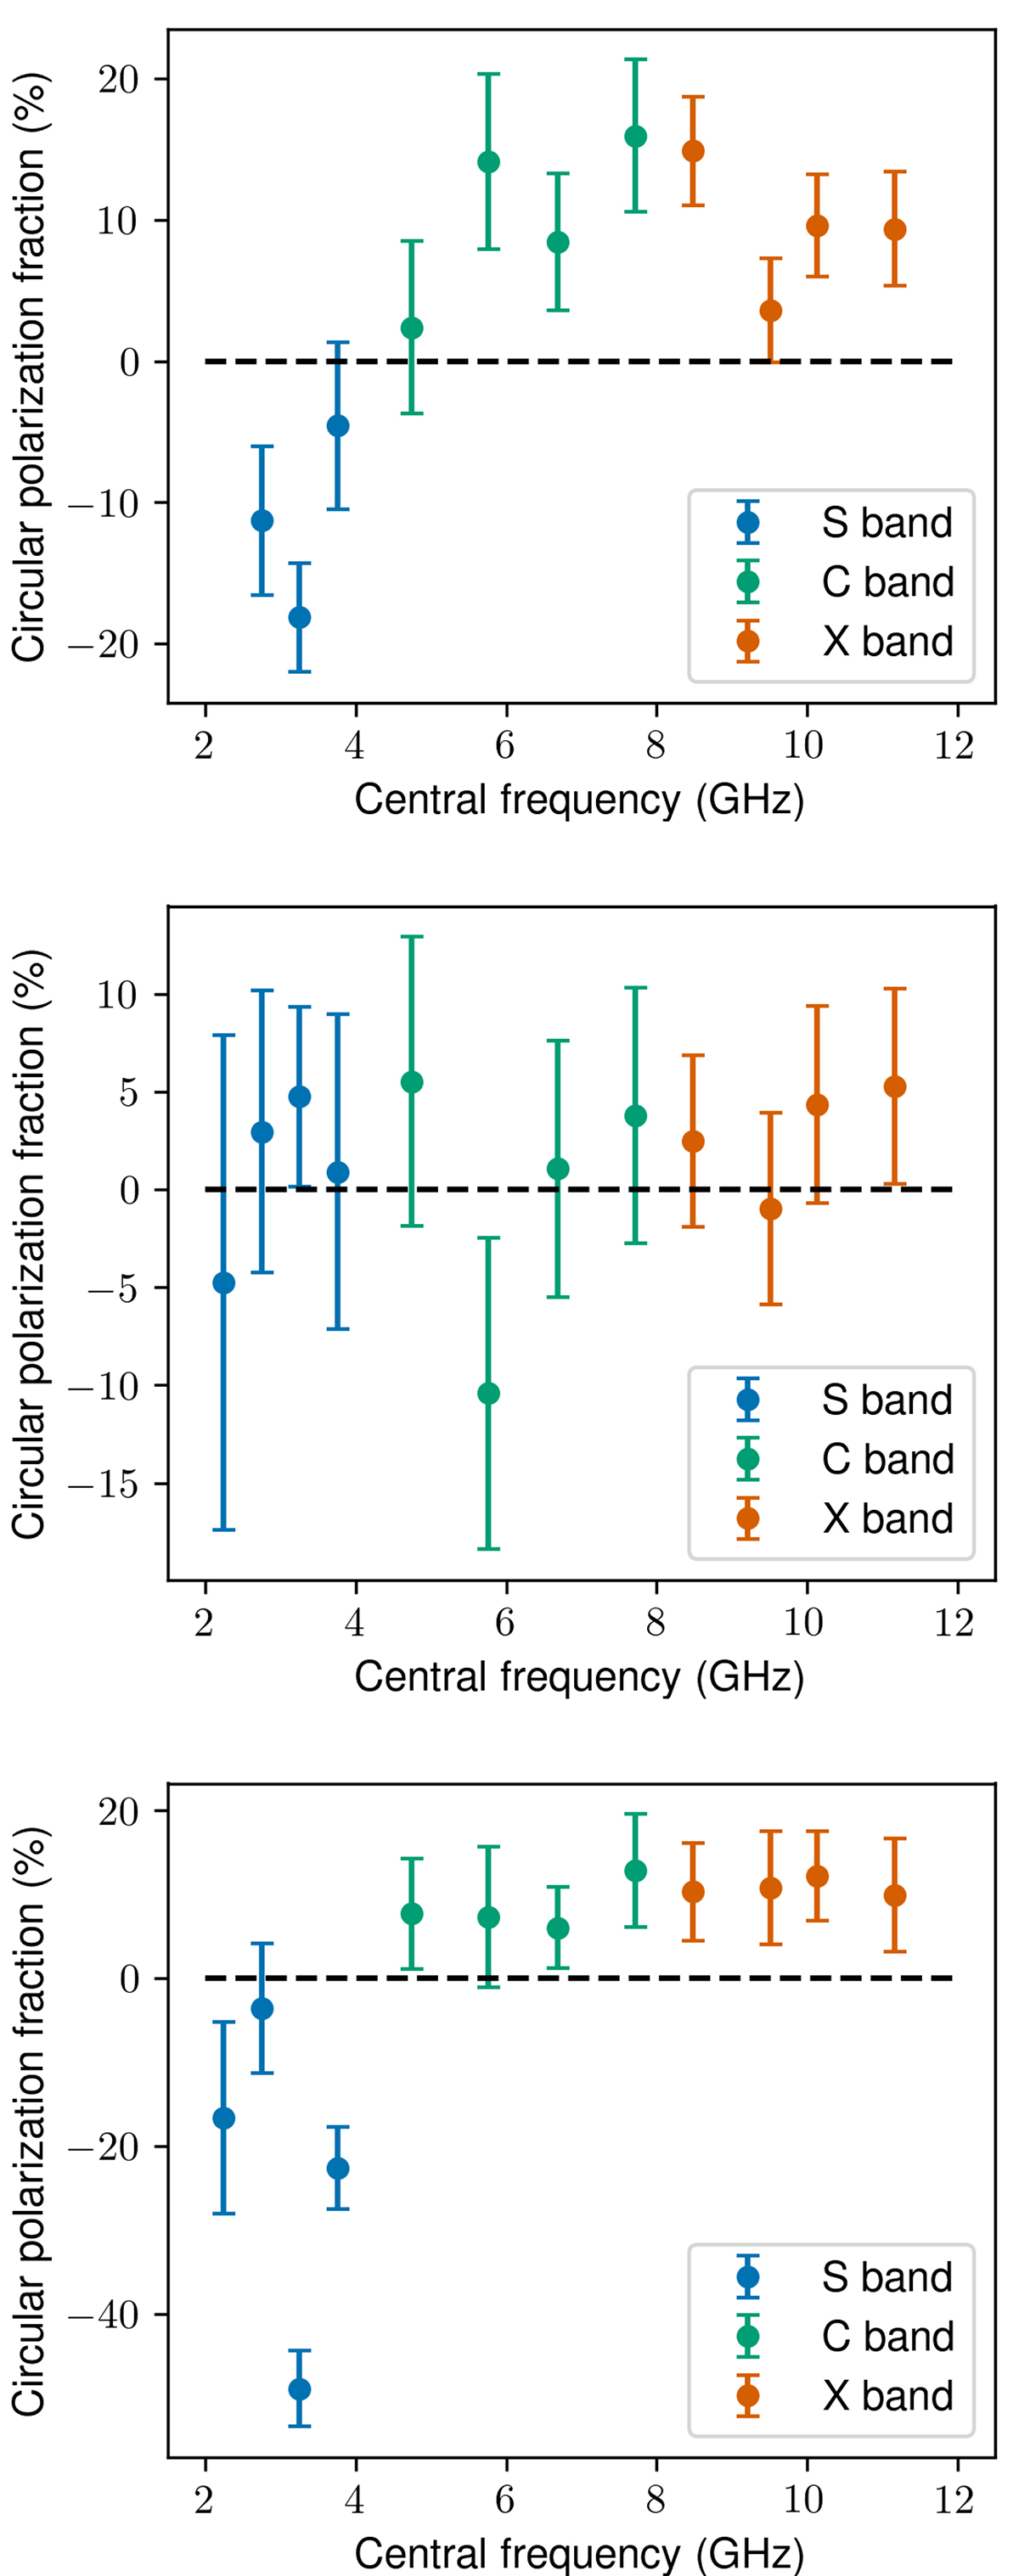
Circular polarisation fraction of QS Vir in all epochs. Each frequency band was separated into 4 sets of spectral windows and imaged separately. The top panel, November, is missing a data point in S-band due to the first 4 spectral windows being flagged for radio frequency interference (RFI). The negative-most point (49 ± 5% LCP) in the bottom panel, January, corresponds to the range of the peak frequency in the bottom panel of Fig. 1 (3.2 GHz).
Current usage metrics show cumulative count of Article Views (full-text article views including HTML views, PDF and ePub downloads, according to the available data) and Abstracts Views on Vision4Press platform.
Data correspond to usage on the plateform after 2015. The current usage metrics is available 48-96 hours after online publication and is updated daily on week days.
Initial download of the metrics may take a while.