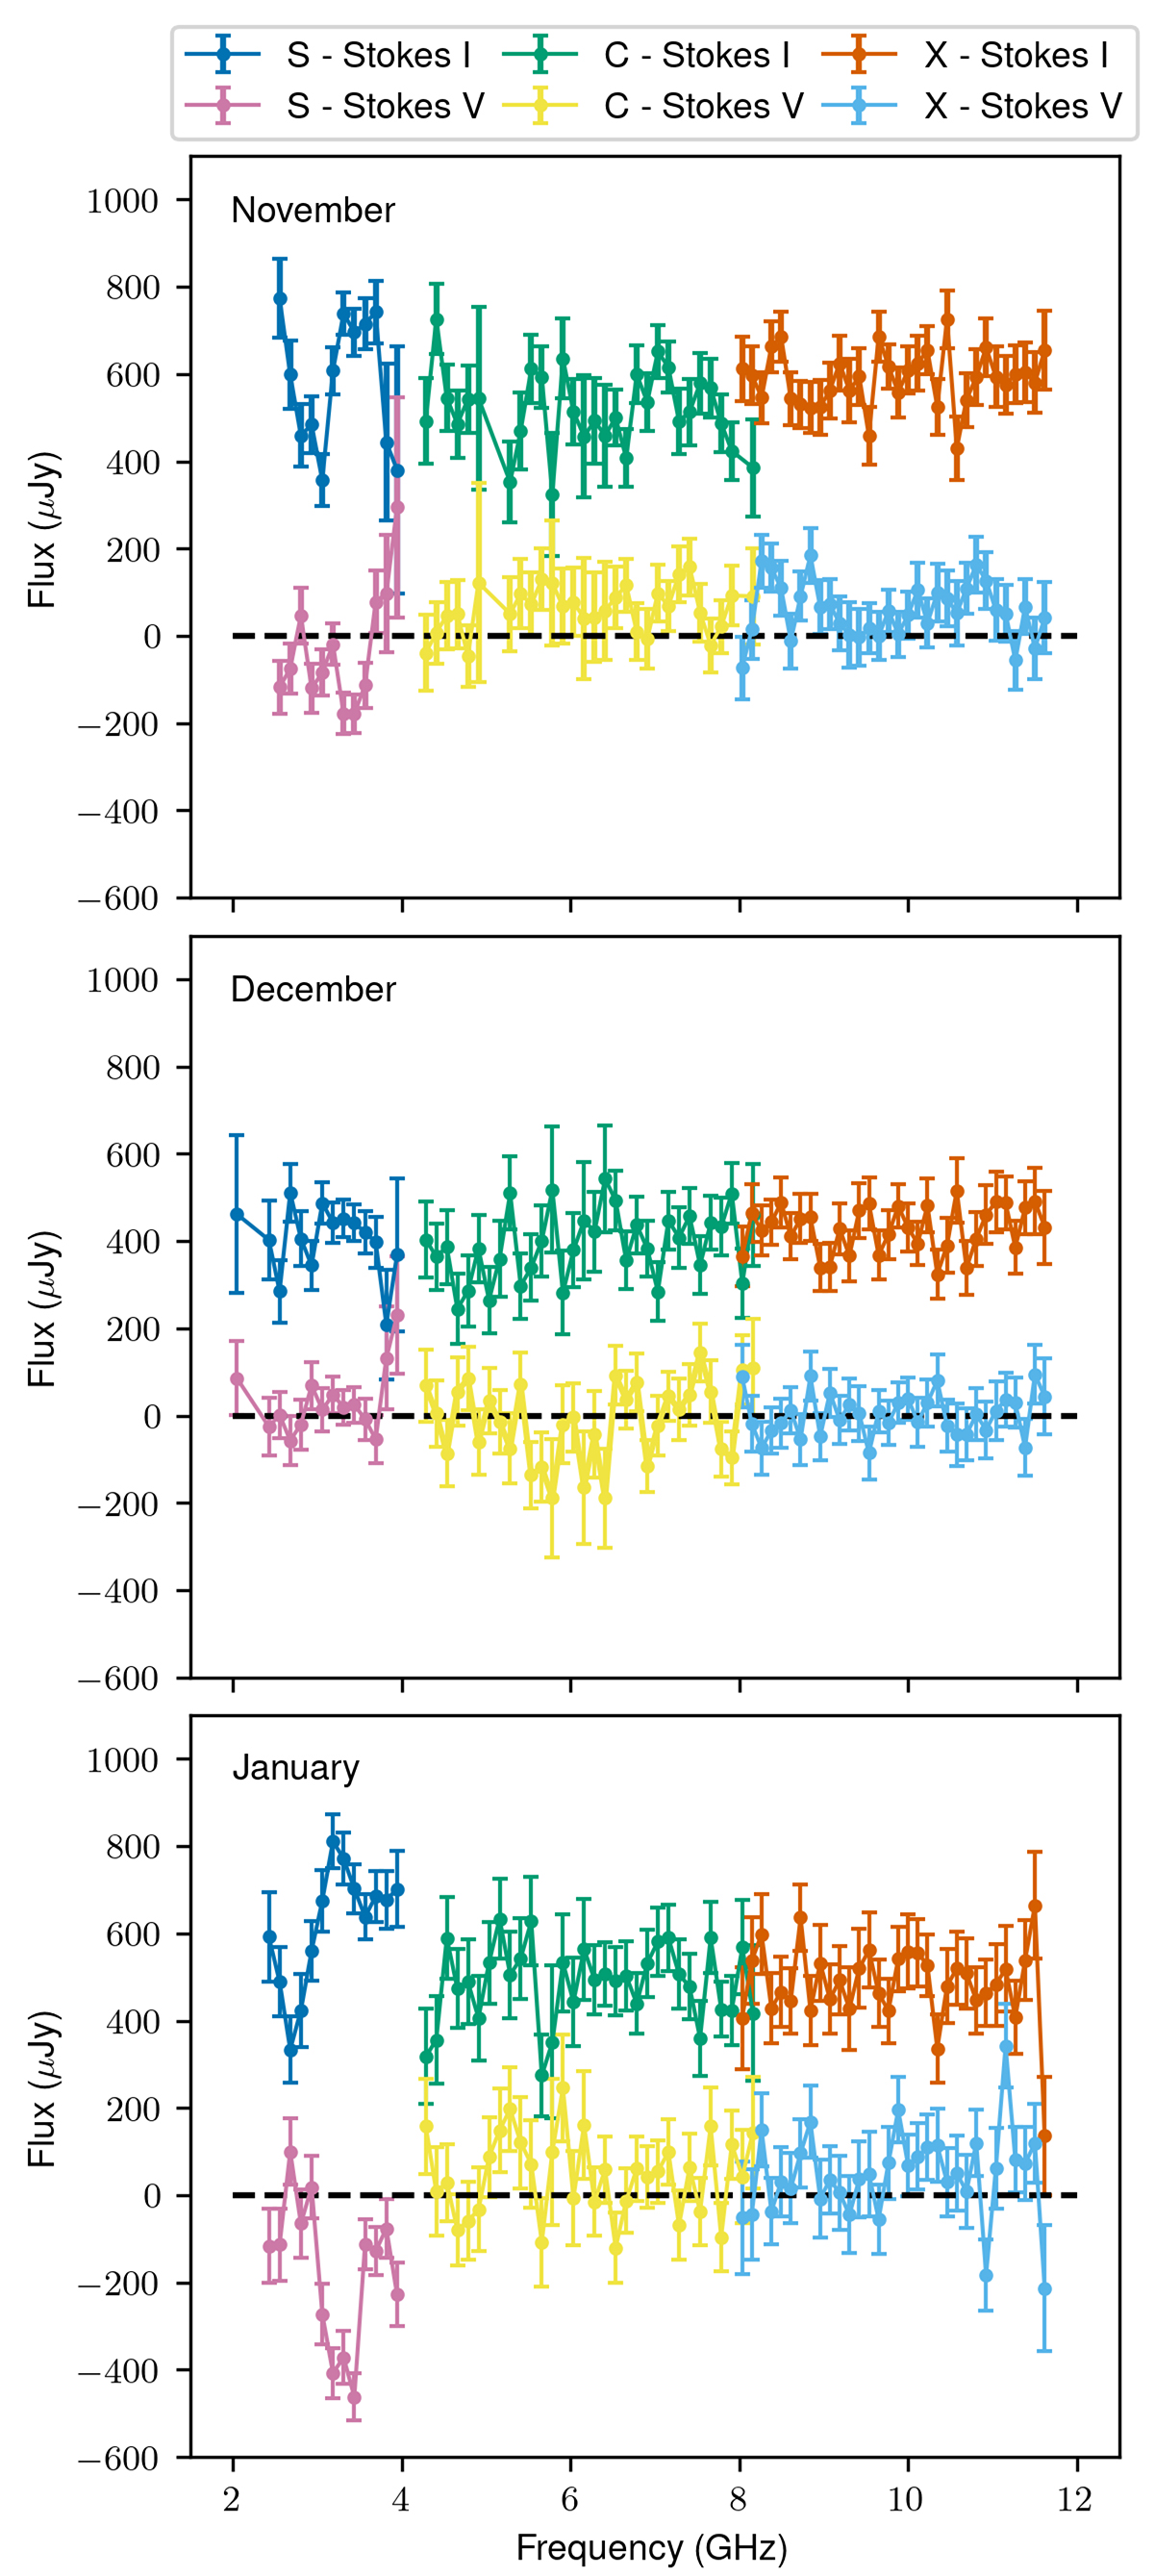
Fig. 1.
Download original image
Spectral energy distribution of QS Vir in November, December, and January, which correspond to the top, middle, and bottom panels respectively. Both Stokes I and Stokes V fluxes are presented by spectral window in order to illustrate the frequencies at which we see the most circular polarisation. The fluctuations near the edges of the bands, such as the lower end of S-band and the upper end of X-band, should be interpreted with caution. Large errors and incorrect flux measurements in these ranges are not uncommon.
Current usage metrics show cumulative count of Article Views (full-text article views including HTML views, PDF and ePub downloads, according to the available data) and Abstracts Views on Vision4Press platform.
Data correspond to usage on the plateform after 2015. The current usage metrics is available 48-96 hours after online publication and is updated daily on week days.
Initial download of the metrics may take a while.