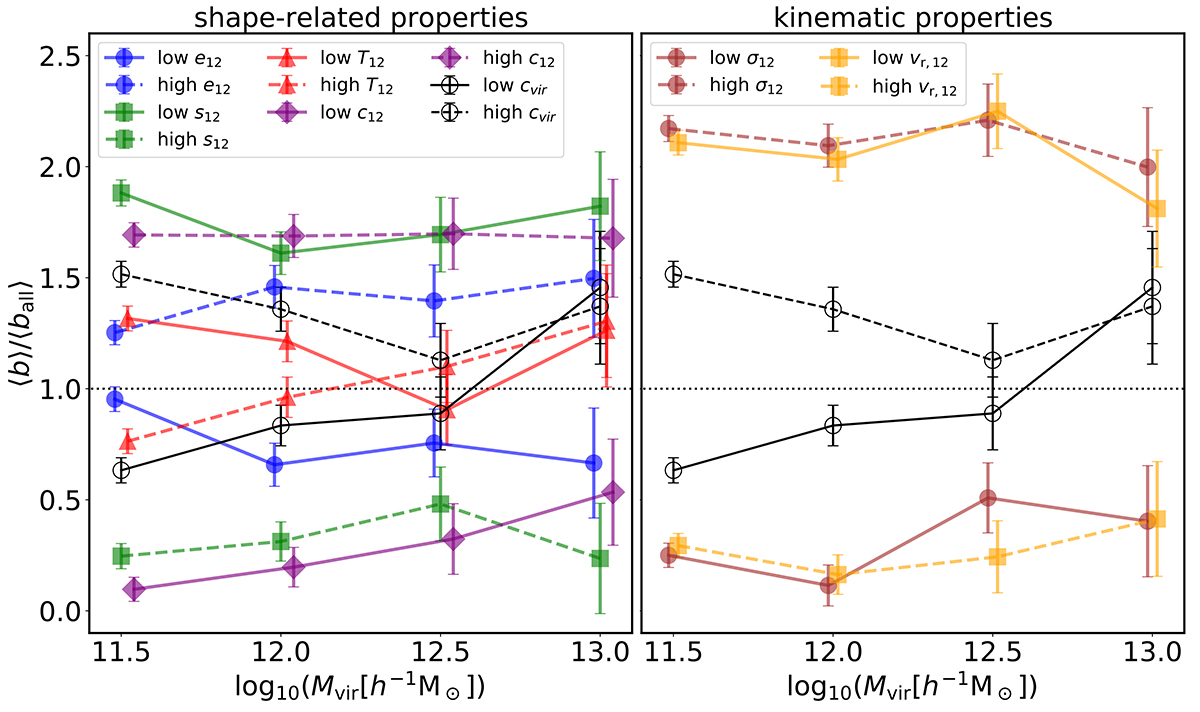
Fig. 3.
Download original image
Similar to Fig. 2 but showing the mean relative bias as a function of halo mass for the same set of properties, which are related to the shape (left) and kinematics (right) of the initial clouds. The mean relative bias is simply defined as the ratio between the mean bias of the low- or high-percentile subset and the mean bias of the entire mass bin. Errors were estimated using a bootstrap procedure based on 1000 resampling subsets. The lines connecting data points are simply added to facilitate the readability of the plot.
Current usage metrics show cumulative count of Article Views (full-text article views including HTML views, PDF and ePub downloads, according to the available data) and Abstracts Views on Vision4Press platform.
Data correspond to usage on the plateform after 2015. The current usage metrics is available 48-96 hours after online publication and is updated daily on week days.
Initial download of the metrics may take a while.