Fig. 2.
Download original image
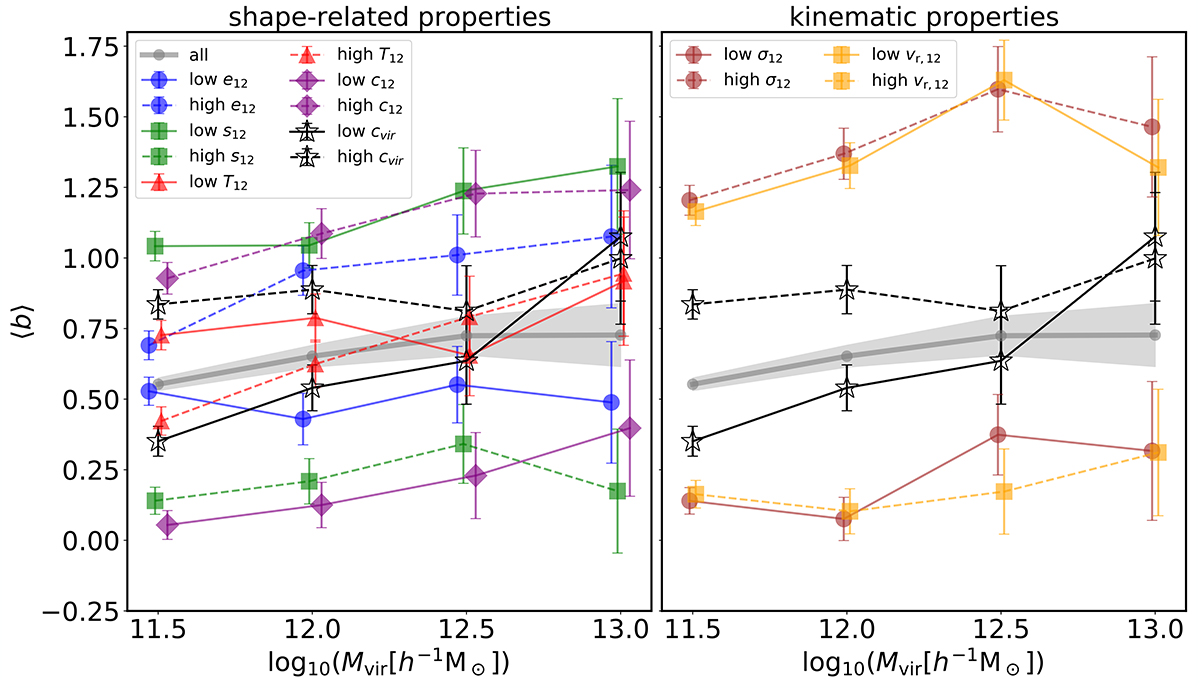
Secondary halo bias (measured at z = 0) produced by a set of properties related to the shape (left) and kinematics (right) of the collapsing regions at z = 12 from which z = 0 halos in specific mass bins originate. These results are compared with the assembly bias signal, represented here by the concentration, cvir, secondary dependence. The mean biases in equal-size percentile subsets encompassing halos with the 20% lowest and highest values of the corresponding property in each mass bin are shown as a function of halo mass, along with the mean bias of the entire population in that mass bin. Errors were estimated using a bootstrap technique based on 1000 resampling subsets. The lines connecting data have been added only for the sake of a better visualization of the differences between subsets.
Current usage metrics show cumulative count of Article Views (full-text article views including HTML views, PDF and ePub downloads, according to the available data) and Abstracts Views on Vision4Press platform.
Data correspond to usage on the plateform after 2015. The current usage metrics is available 48-96 hours after online publication and is updated daily on week days.
Initial download of the metrics may take a while.