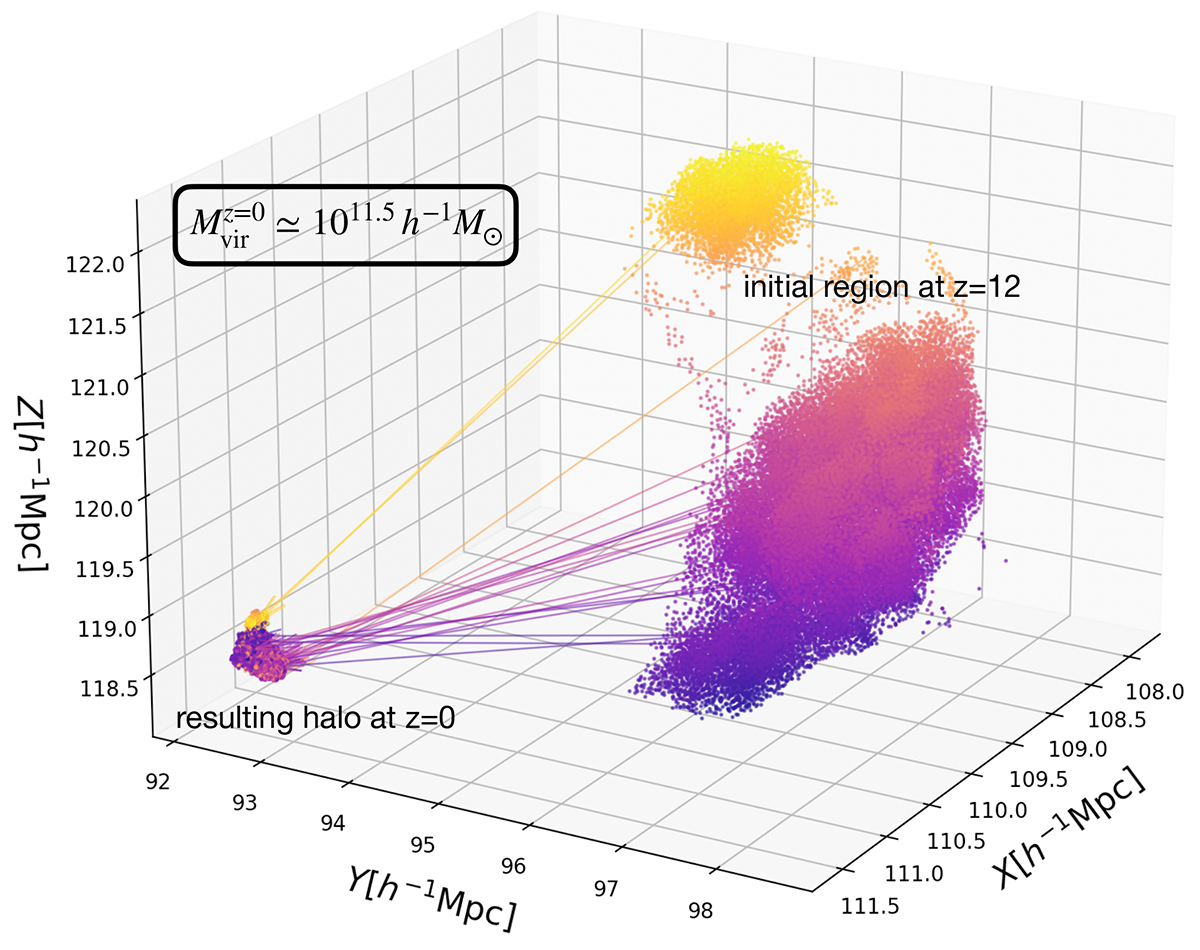
Fig. 1.
Download original image
Collapsing region at z = 12 and the corresponding halo that forms from that patch of the density field, viewed at z = 0. Only 10% of the particles are plotted for the sake of simplicity. The color code indicates the height on the z-axis at z = 12, from low (purple) to high (yellow). Arrows indicate the initial and final location of a few individual DM particles. Note that this particular region is composed of two disjointed subregions that are in the process of collapsing and merging.
Current usage metrics show cumulative count of Article Views (full-text article views including HTML views, PDF and ePub downloads, according to the available data) and Abstracts Views on Vision4Press platform.
Data correspond to usage on the plateform after 2015. The current usage metrics is available 48-96 hours after online publication and is updated daily on week days.
Initial download of the metrics may take a while.