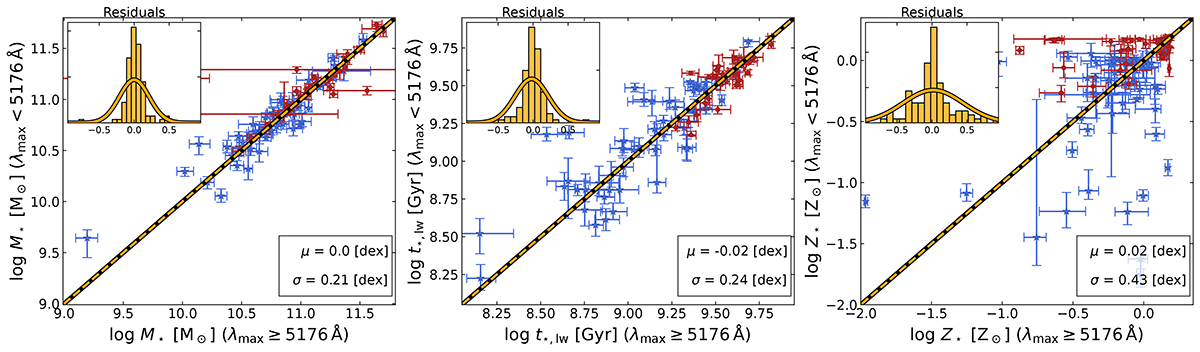
Fig. 9.
Download original image
Comparison of the main stellar population properties of galaxies with duplicate observations in LEGA-C DR3. Galaxies are color-coded by their UVJ diagram classification as star forming (blue stars) and quiescent (red points). The dashed orange line shows the one-to-one relation. The distribution of residuals is shown in the top-left corner of each panel, while the statistics of the mean offset (μ) and variance (σ) are shown in the bottom-right corner.
Current usage metrics show cumulative count of Article Views (full-text article views including HTML views, PDF and ePub downloads, according to the available data) and Abstracts Views on Vision4Press platform.
Data correspond to usage on the plateform after 2015. The current usage metrics is available 48-96 hours after online publication and is updated daily on week days.
Initial download of the metrics may take a while.