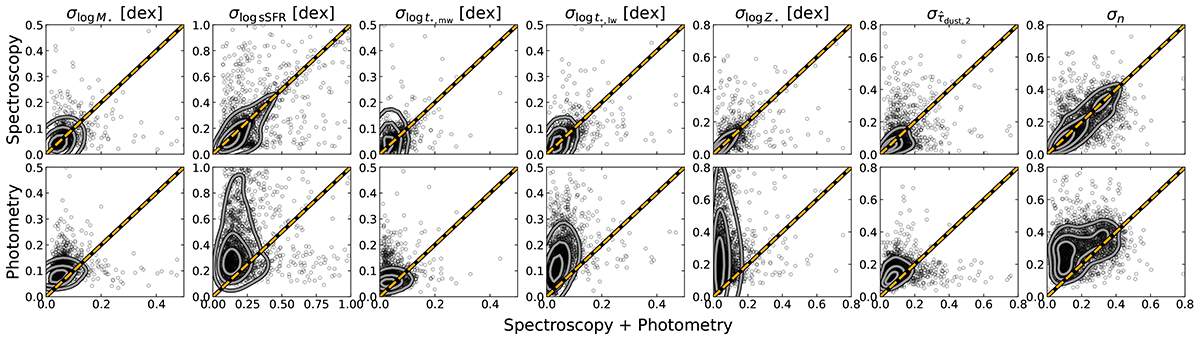
Fig. 8.
Download original image
Comparison of the upper uncertainties of the main global properties of our primary galaxy sample from three different SED fitting runs. The properties presented here are the same as in Fig. 7. The top row shows the comparison of the uncertainties of our fiducial run with those from the spectroscopy-only run, and the bottom row shows the comparison with the photometry-only run. Contours enclose 20%, 50% and 80% of the total data. The dashed orange line shows the one-to-one relation.
Current usage metrics show cumulative count of Article Views (full-text article views including HTML views, PDF and ePub downloads, according to the available data) and Abstracts Views on Vision4Press platform.
Data correspond to usage on the plateform after 2015. The current usage metrics is available 48-96 hours after online publication and is updated daily on week days.
Initial download of the metrics may take a while.