Fig. 4.
Download original image
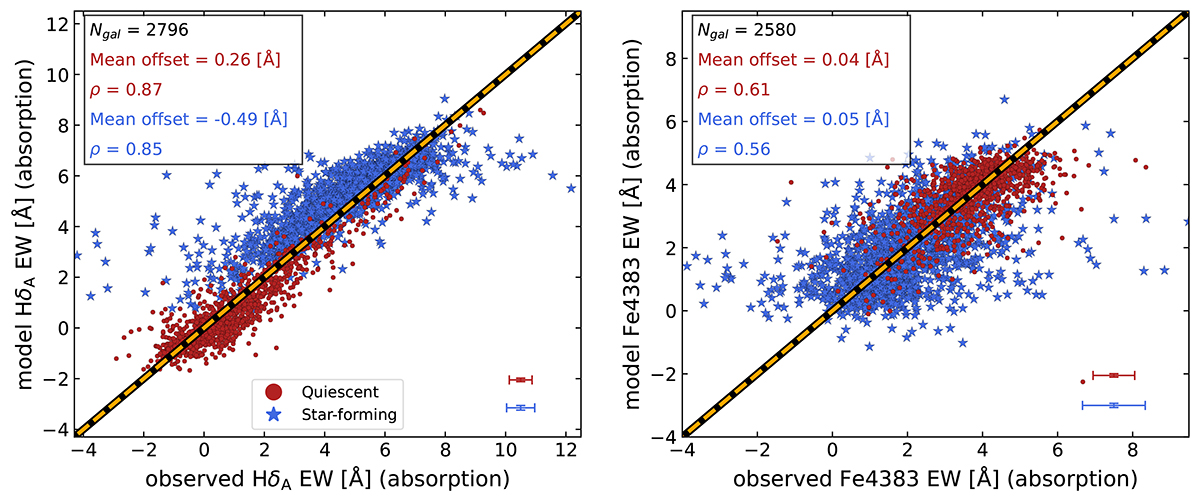
Modeled HδA and Fe4383 absorption features from Prospector fits compared to observations. Galaxies are color-coded by their UVJ diagram classification as star-forming (blue stars) and quiescent (red points). The absorption-only models are compared to the observed values (corrected for emission). The dashed orange line shows the one-to-one relation. The statistics of the mean offsets and the Spearman’s rank correlation coefficient (ρ) of each galaxy populations, are shown in the top-left corner of each panel. The typical uncertainties of each axis and galaxy population are shown in the bottom-right corner of each panel.
Current usage metrics show cumulative count of Article Views (full-text article views including HTML views, PDF and ePub downloads, according to the available data) and Abstracts Views on Vision4Press platform.
Data correspond to usage on the plateform after 2015. The current usage metrics is available 48-96 hours after online publication and is updated daily on week days.
Initial download of the metrics may take a while.