Fig. 3.
Download original image
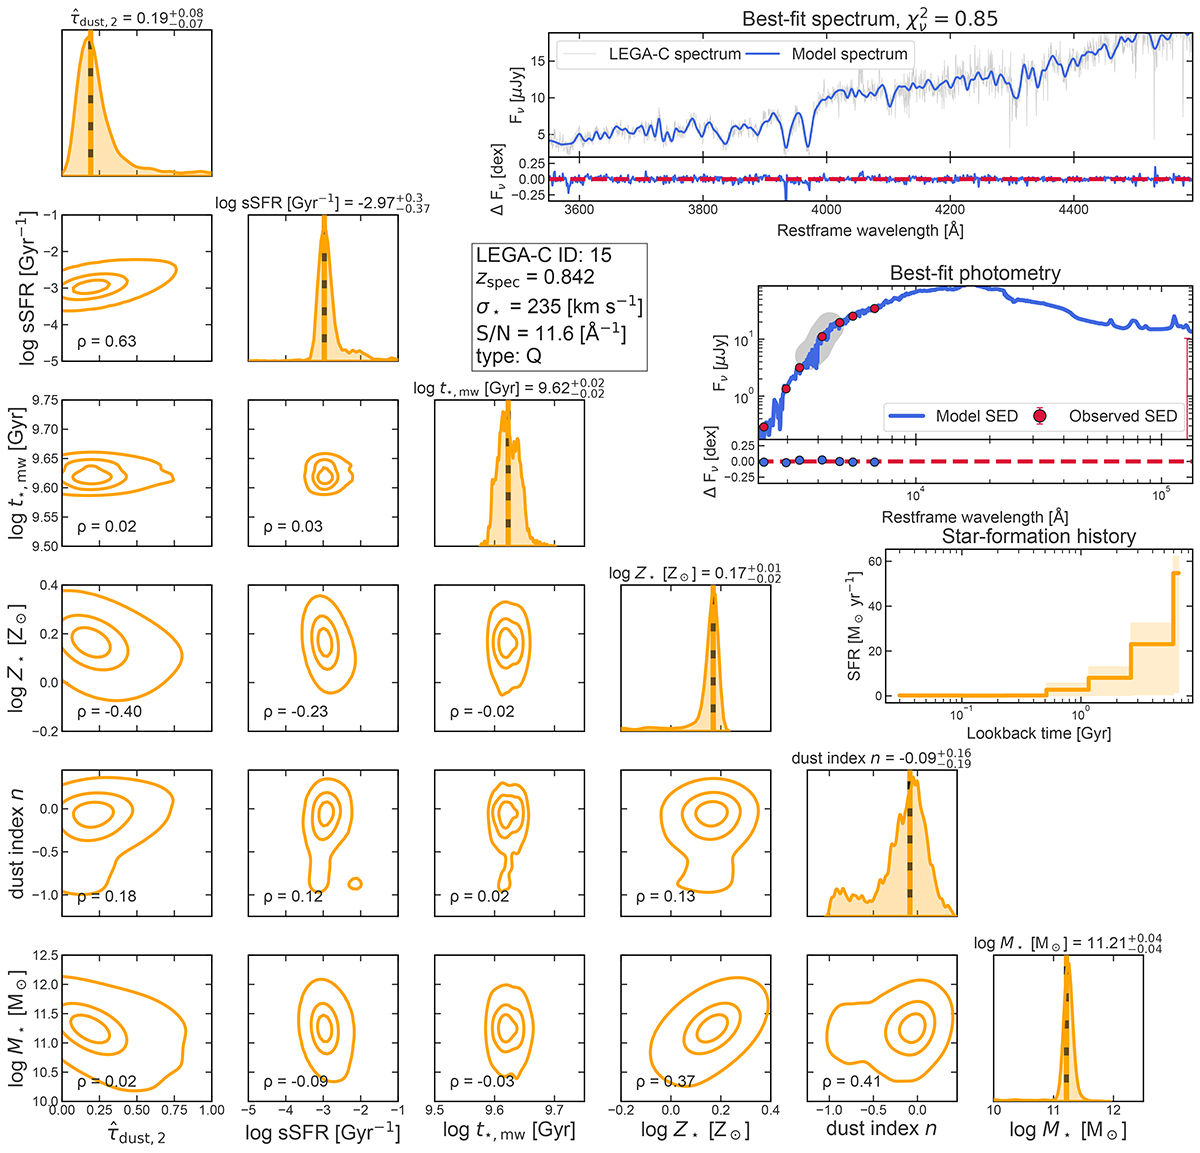
Joint posterior distributions of various physical quantities, best-fit spectrum, best-fit SED, and retrieved SFH, for an example quiescent galaxy at zspec = 0.842. In the cornerplot, we present the posterior distributions of ![]() , sSFR, t⋆, mw, Z⋆, dust attenuation slope index (n), and M⋆. The contours enclose 20%, 50% and 80% of the total data. The vertical black dashed line indicates the median value of each physical quantity. The Spearman’s correlation coefficient, ρ, indicates the strength of the correlation between two posterior distributions. The inset in the right corner of the figure contains three panels. Top panel: comparison of the observed spectrum (gray line) with the fitted model (blue line). Middle panel: comparison of the observed photometry (red points) with the best-fit SED (blue line). The shaded gray region covers the wavelength range of the corresponding LEGA-C spectrum. The subpanels associated with the top and middle panels show the absolute residuals, defined as ΔFν = logobs/mod. Bottom panel: the SFH posterior.
, sSFR, t⋆, mw, Z⋆, dust attenuation slope index (n), and M⋆. The contours enclose 20%, 50% and 80% of the total data. The vertical black dashed line indicates the median value of each physical quantity. The Spearman’s correlation coefficient, ρ, indicates the strength of the correlation between two posterior distributions. The inset in the right corner of the figure contains three panels. Top panel: comparison of the observed spectrum (gray line) with the fitted model (blue line). Middle panel: comparison of the observed photometry (red points) with the best-fit SED (blue line). The shaded gray region covers the wavelength range of the corresponding LEGA-C spectrum. The subpanels associated with the top and middle panels show the absolute residuals, defined as ΔFν = logobs/mod. Bottom panel: the SFH posterior.
Current usage metrics show cumulative count of Article Views (full-text article views including HTML views, PDF and ePub downloads, according to the available data) and Abstracts Views on Vision4Press platform.
Data correspond to usage on the plateform after 2015. The current usage metrics is available 48-96 hours after online publication and is updated daily on week days.
Initial download of the metrics may take a while.