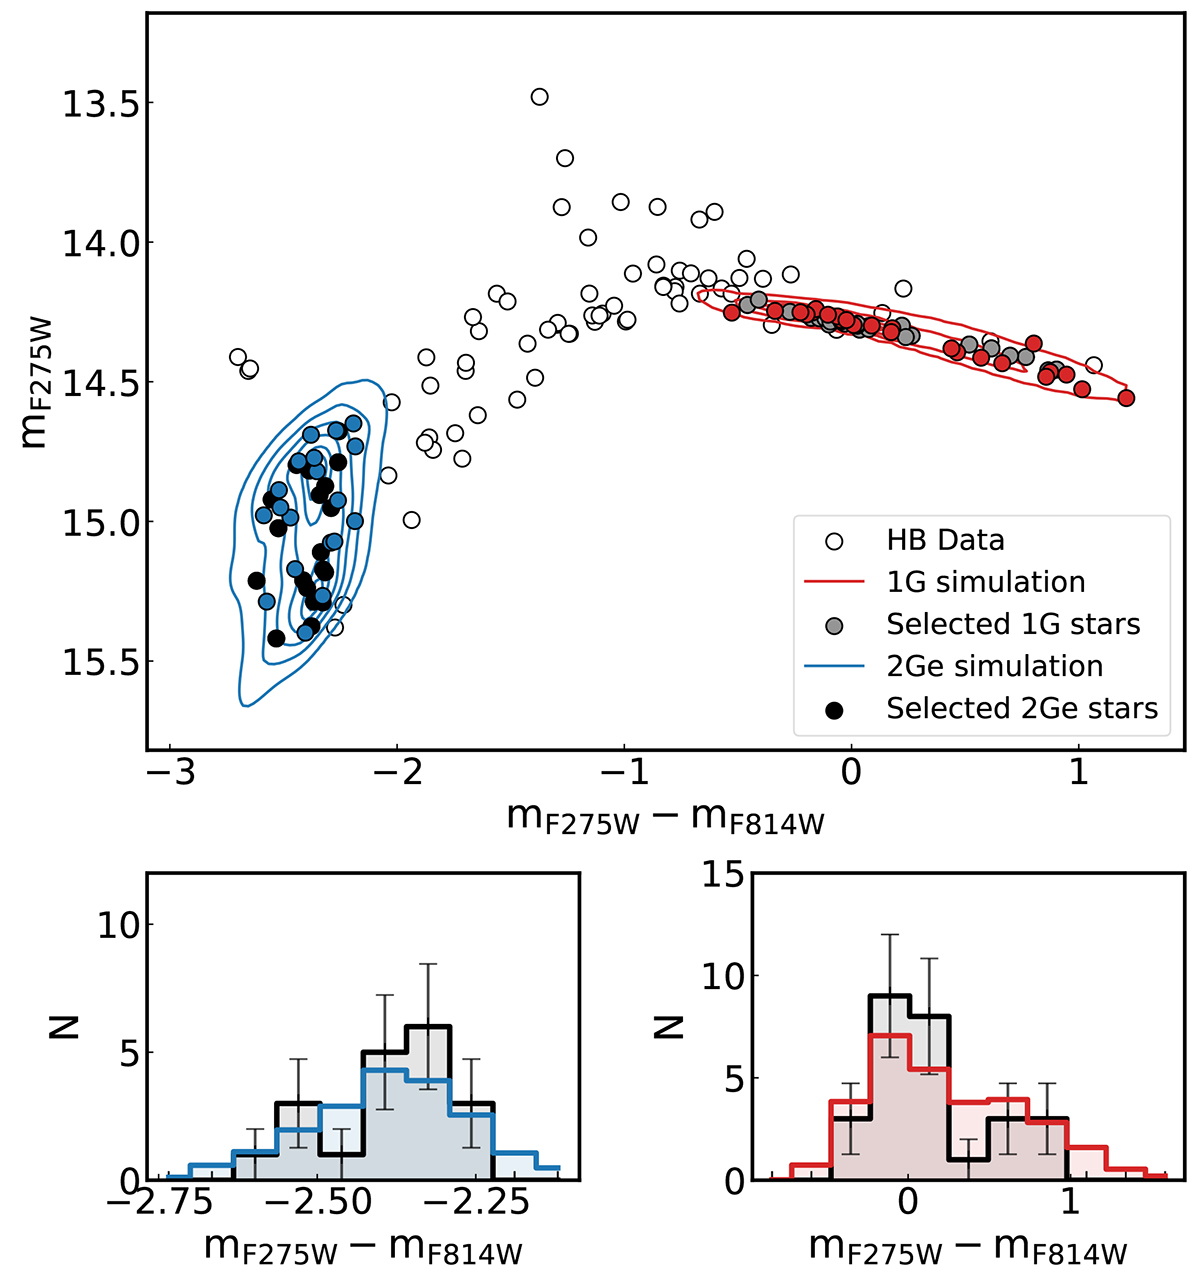
Fig. 2.
Download original image
Best-fit simulations for the 1G and 2Ge stars in NGC 6752. The grey and black points are the stars belonging to the 1G and the 2Ge, respectively, selected according to the simulation area (red and blue, respectively, for the 1G and the 2Ge). The coloured points, colour-coded in the same way as the simulations, are a typical realisation of each population. Histograms in the bottom panels compare the colour distribution of the two simulations (red and blue) and the selected stars (black). The simulation histograms are normalized to the number of stars included in each population.
Current usage metrics show cumulative count of Article Views (full-text article views including HTML views, PDF and ePub downloads, according to the available data) and Abstracts Views on Vision4Press platform.
Data correspond to usage on the plateform after 2015. The current usage metrics is available 48-96 hours after online publication and is updated daily on week days.
Initial download of the metrics may take a while.